• Bats in Austin do not have or spread SARS-CoV-2 (the virus that causes COVID-19 in humans). SARSCoV-2 is not found in North American bat species at present.
• Transmission of COVID-19 is from humans to other humans.
• There are theoretical concerns about the possibility for transmission of SARS-CoV-2 from humans to bats. Research is underway; until we know more, precautions to minimize the chance of North American bats of being exposed to SARS-CoV-2 are being taken. This is not unique to bats – there are also concerns of possible transmission from humans to other wildlife species, particularly mustelids, felids and canids.
• Avoid handling live bats and any wildlife. If handling live bats cannot be avoided, follow recommendations about PPE to prevent spread of respiratory droplets – a face mask, thick gloves, etc.
The concern is transmission of SARS-CoV-2 from humans to bats, not vice versa, so handling dead bats is fine. Dead bats provide valuable information to bat biologists. To collect a dead bat, wear gloves, wrap in paper towel, and double bag in a Ziploc. Place on ice or in freezer until the bat can be retrieved. Avoid any skin contact to prevent rabies exposure and keep pets and children away.
Bat conservation and COVID-19
• Many bat species have adapted to urban and rural environments, where they coexist safely with people. Ask us about living with bats safely.
• It is important that bats and bat habitat not be destroyed because of unfounded fears over coronavirus transmission.
• Bats in North America are in trouble from habitat loss and white-nose syndrome – at least two species in Texas have experienced sharp decline just this spring.
• Bats are essential to our Texas ecosystems and economy. Nationwide, bats are estimated to provide $23 billion of natural pest control each year.
• Killing bats would not have any effect on the spread of COVID-19, but would negatively affect bat populations, conservation efforts, and our economy.
Austin Bat Refuge would like to remind people we are here to answer your questions and collect reports on bat sightings, bat roosts, and dead bats. Contact us at info@austinbatrefuge.org and 512-695-4116 or 512-799-8847.
(This post borrowed and modified from BC Community Bat Program)
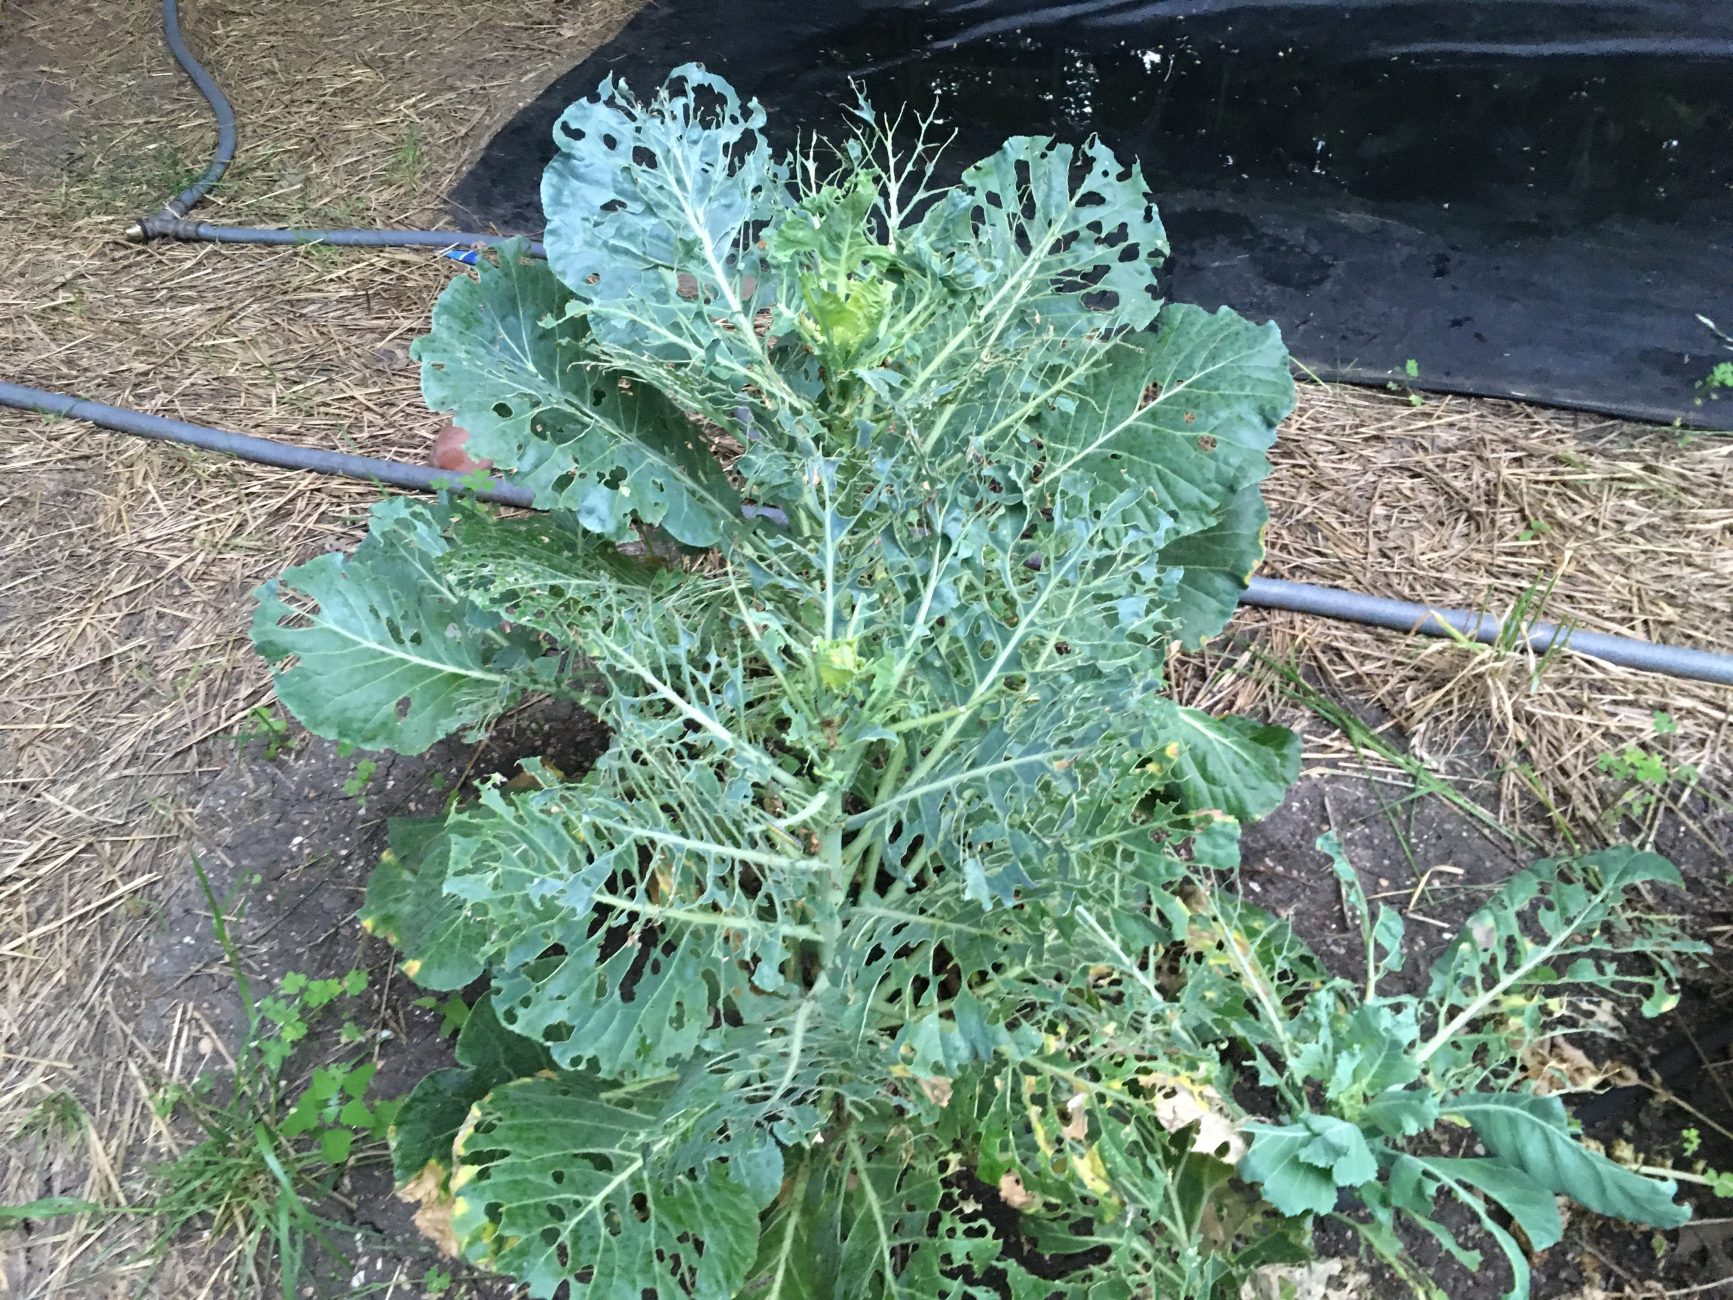
Ever wonder about bat’s pest control services? We see evidence every morning that bats are at work for us, all night long.
We grow crops to attract moths; the females lay their eggs on our brassicas such as collard greens, curly kale, swiss chard, and cabbage. We allow the larvae to eat all they want of the nutritious greens and they soon become moths. Without bats to balance the numbers of crop pests, our food crops would take a beating.
Collard greens moth nursery
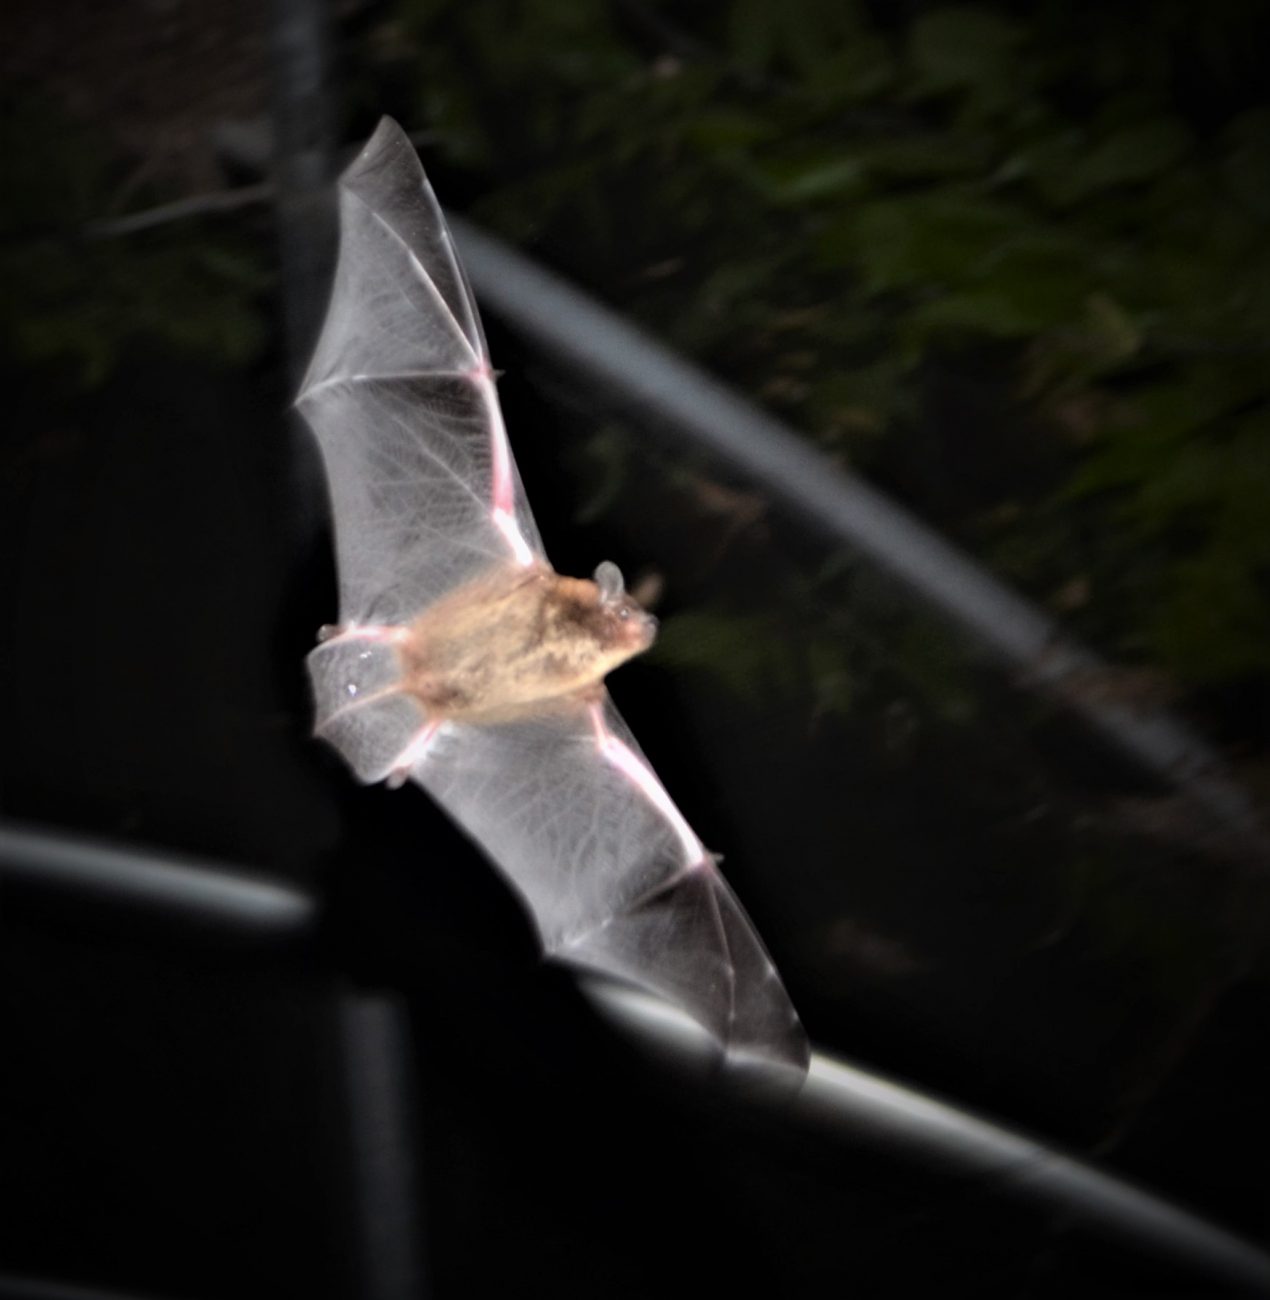
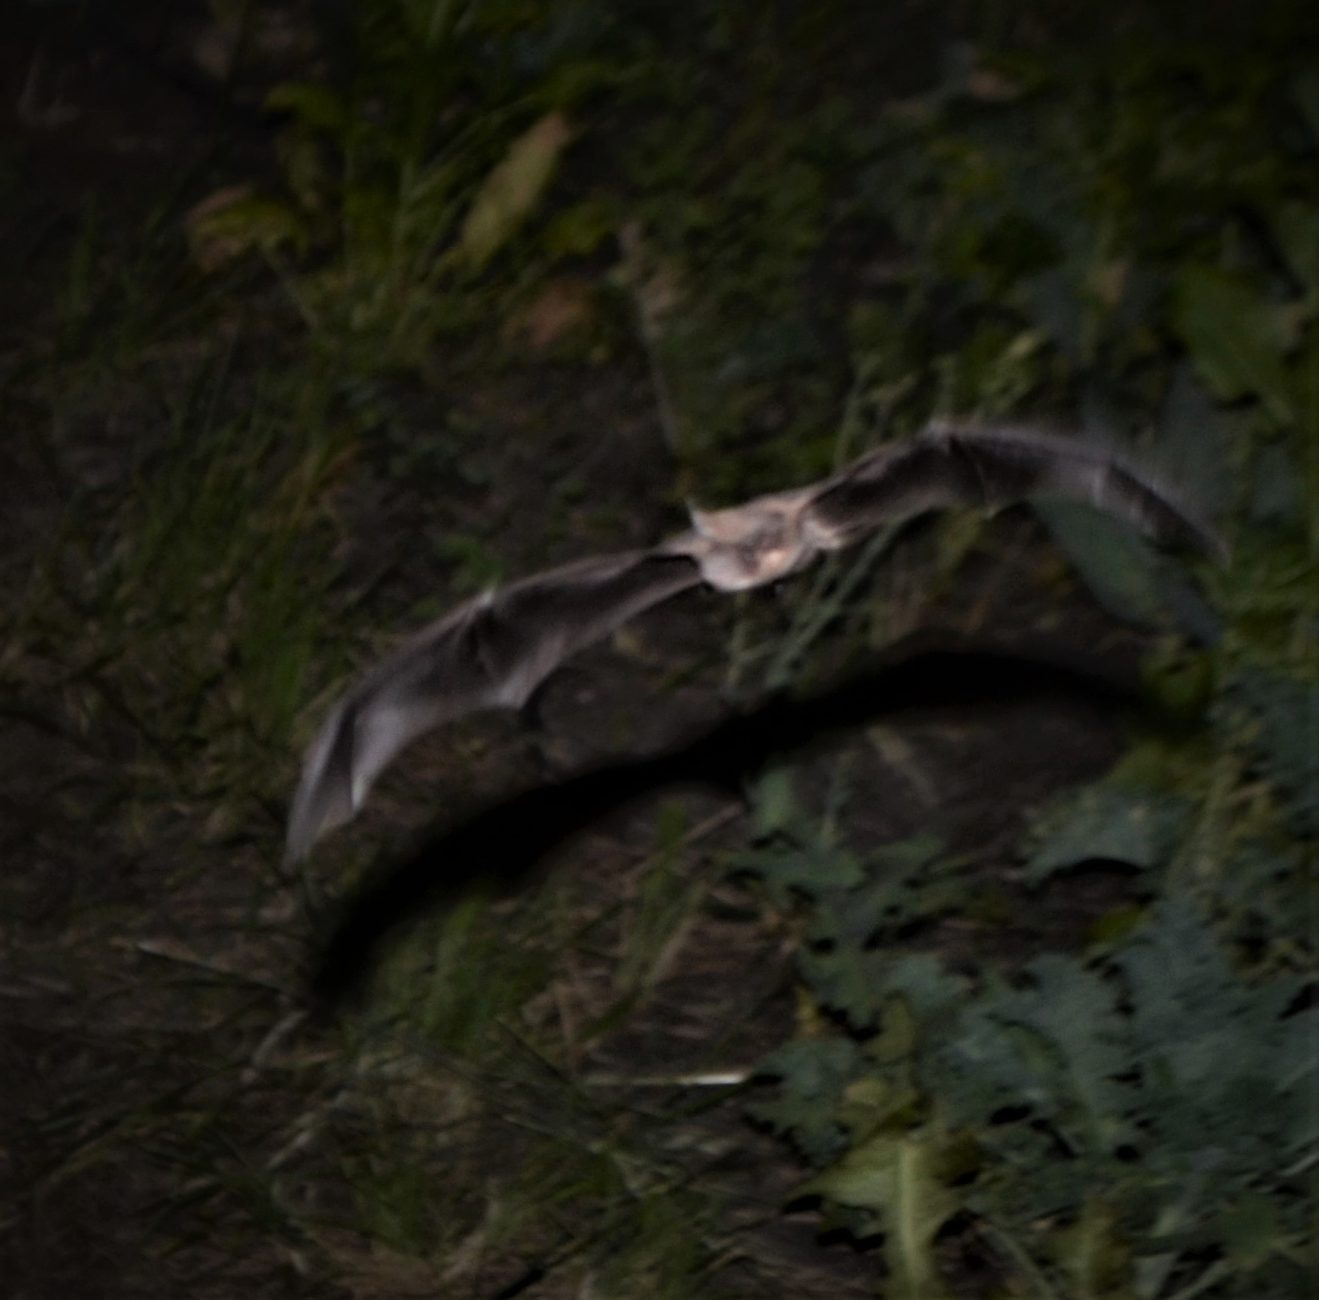
The flight cage is full of moths nowadays and the rehabilitating bats are loving their hunting practice.
female evening bat on the huntYoung Mexican free-tailed bat skimming the crops
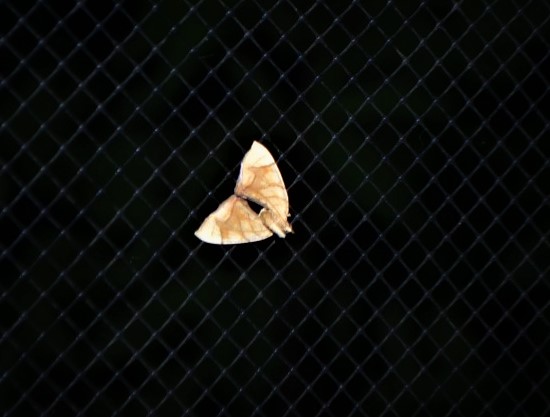
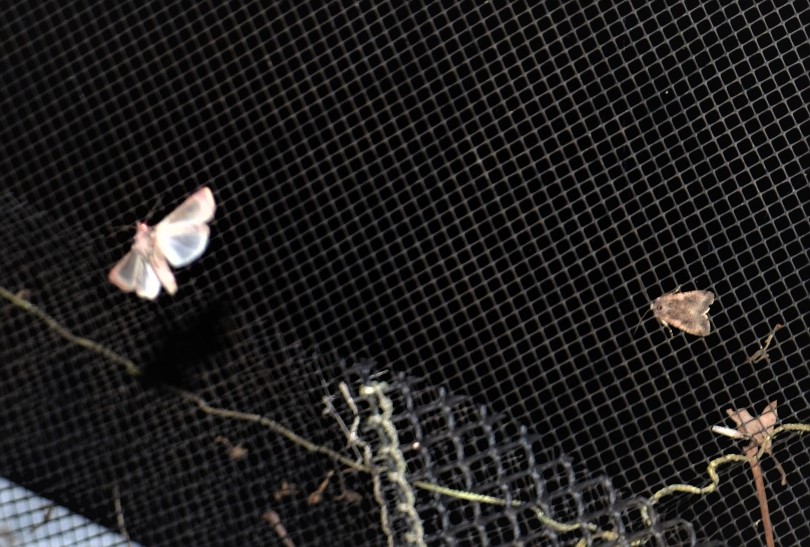
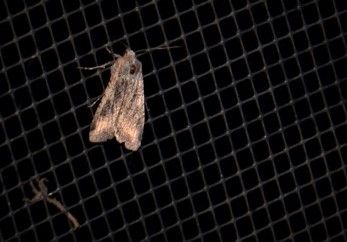
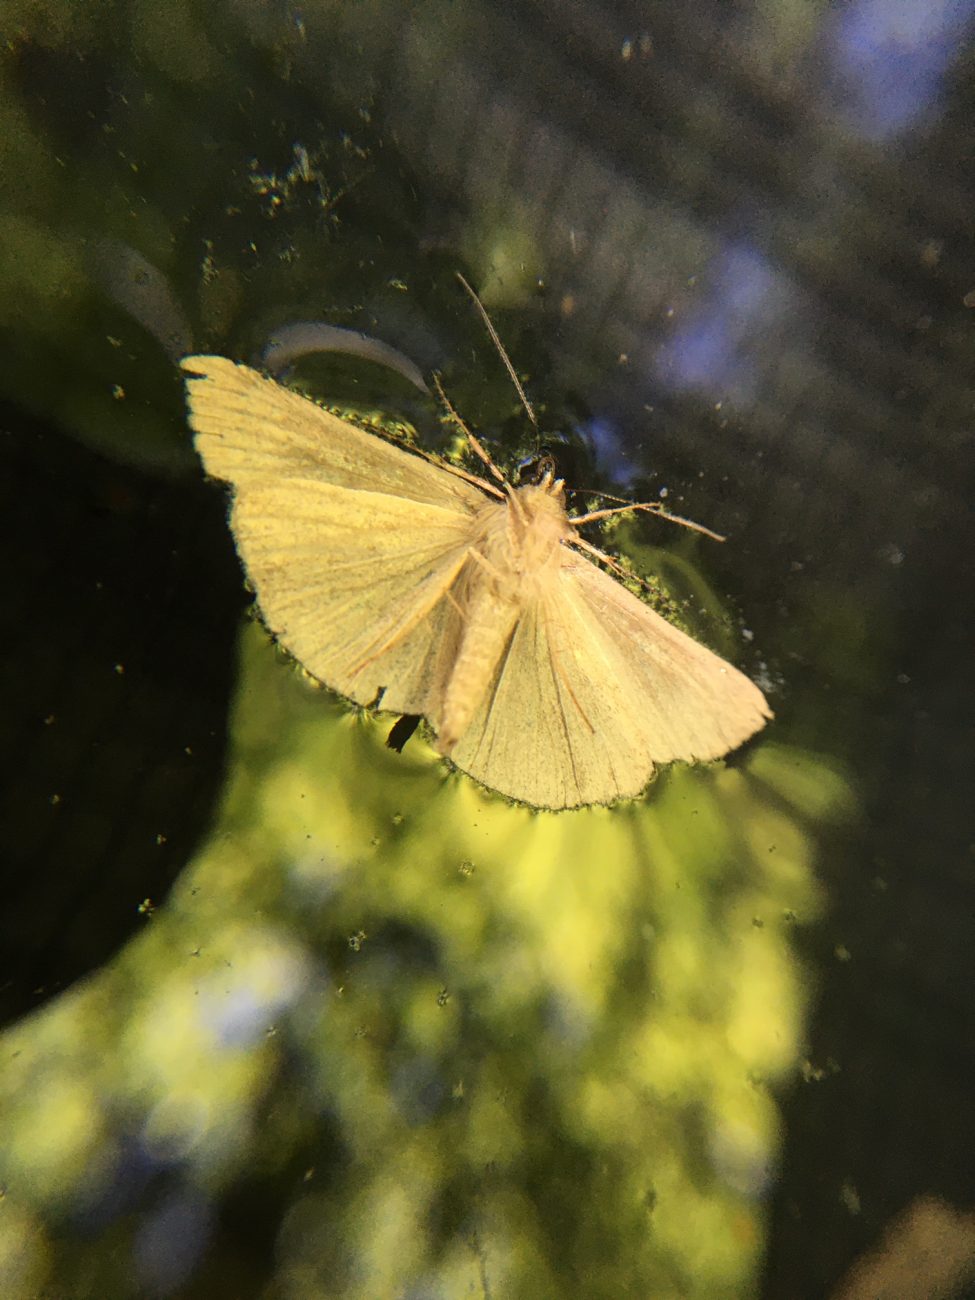
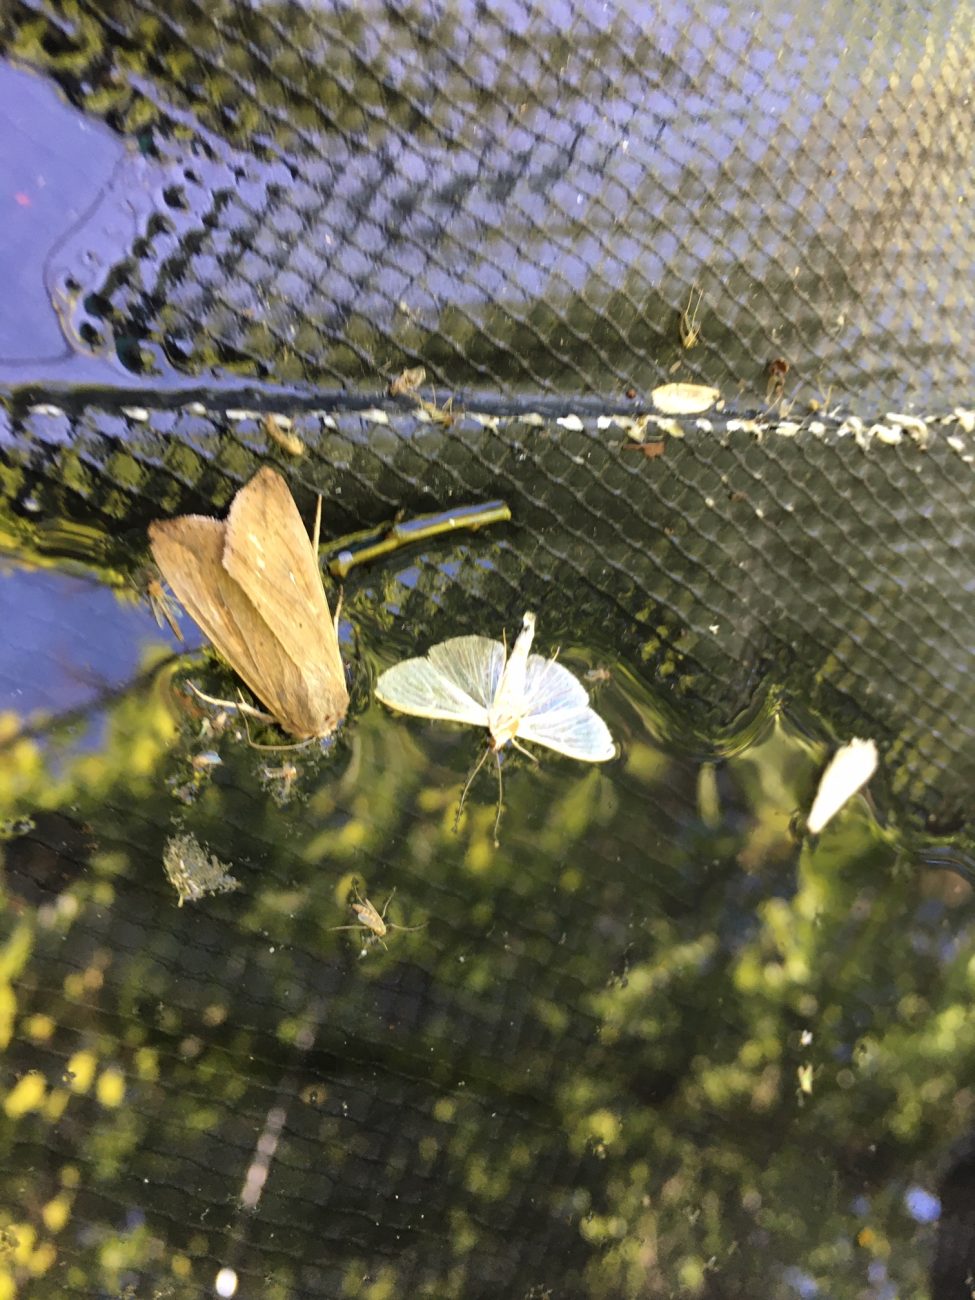
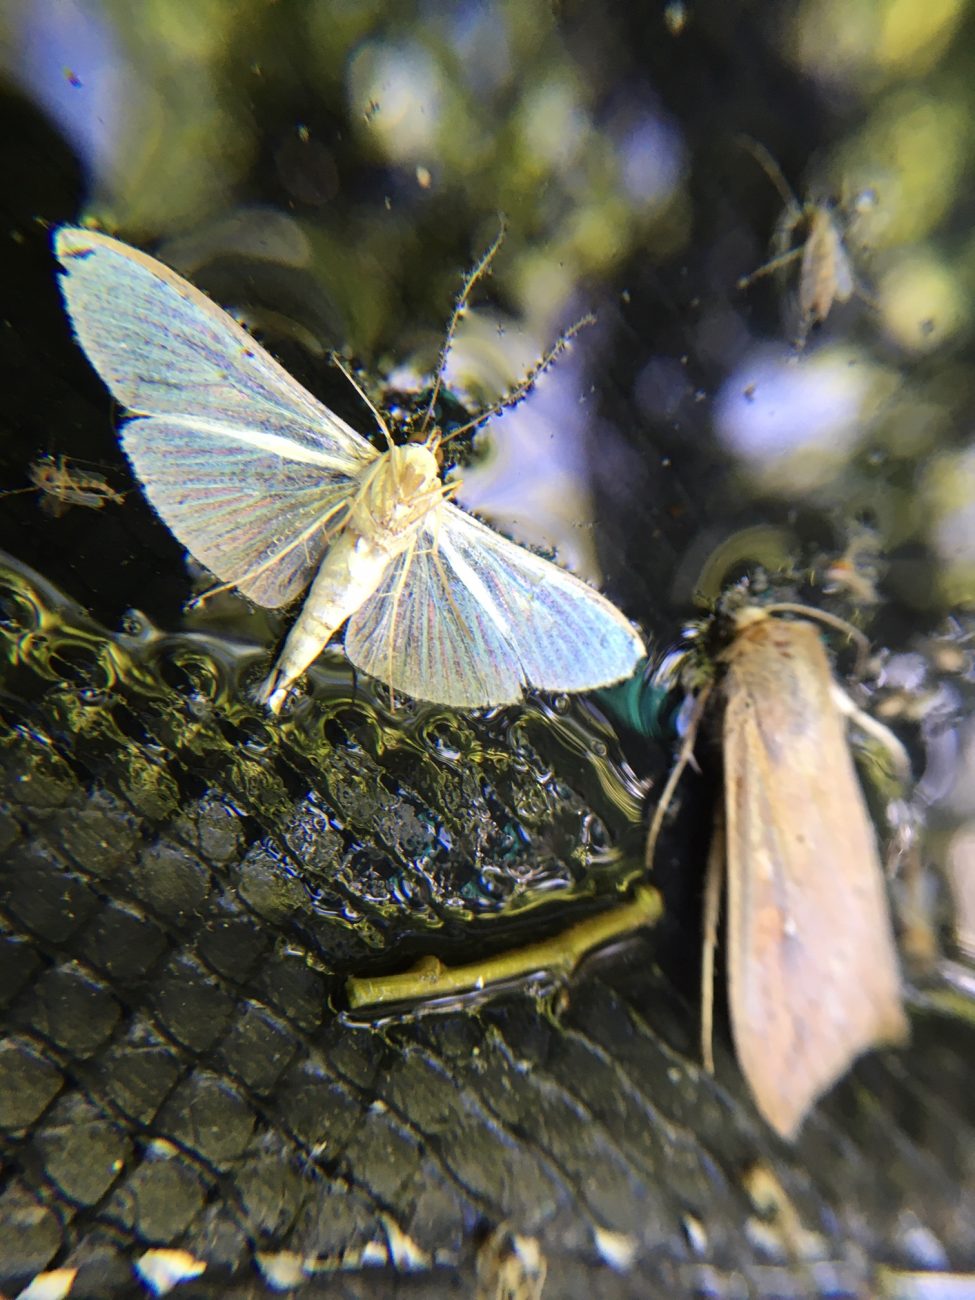
When moths hear echolocation of an approaching bat, millions of years of evolution kick in and they employ various defense mechanisms. In our aviary some fly erratically while others drop to the ground to evade the bats. Normally dropping works well as they hide in the grass, but in our fight cage they often drop into the bats’ drinking troughs. Each morning we go out to rescue the moths trapped by the surface tension of the water.
Live moths trapped by surface tension
Morning moth lifeguard dutiesAll moths are extraordinary – some are exquisite
Soon the brassicas will have served their purpose. We’ve eaten lots this winter, but as the insects begin to ravage them in the spring, they form a bitter latex in their leaves that makes them unpalatable to the larvae, but also to us! Soon we will replace them with a cover crop, to fix nitrogen in the soil and protect the soil from the hot summer sun. And we’ll plant the winter garden again in the fall.
Bats have earned an unwarranted reputation as disease spreaders since the Covid-19 outbreak. With April 17 marking world Bat Appreciation Day, Dr Tigga Kingston sets out to provide the full picture on the misunderstood mammals
It’s 7.20pm at the edge of the rainforest of Krau Wildlife Reserve in Peninsular Malaysia. Plaintive calls of nightjars herald the transition from day to night as silhouettes of bats flitter in the twilight. It is time to head into the forest.
There are five of us tonight; I’m joined by my two PhD students Juliana Senawi (Julie) and Nurul Ain Elias (Ain) and two assistants, Rahman and Amri, from the nearby Jah Hut indigenous village.
During the day Rahman and Amri have spaced out ten harp traps along the network of forest trails. Harp traps, made up of metal rectangular frames about the size of a vertical window with fishing line stretched across, are set on legs across forest trails.
Bats that forage for insects inside the forest understory often follow trails for part of their journey, and although they have very sophisticated echolocation to find their way around and hunt insects, they have trouble detecting the fine fishing lines. They hit the lines and slide down into a long collecting bag where they can roost and rest before we come and get them.
While bats have earned an unwarranted reputation as spreaders of disease, particularly as a result of the Covid-19 outbreak, we have been studying these forest specialists for over two decades and how human activity is impacting their habitats.
Our research shows that because so many are adapted to forest life and the stable resources it provides, they are unable to adjust to landscapes dominated by agriculture and non-timber plantations like rubber and oil palm. We aren’t the only ones to find this, forest-dwelling bats across Southeast Asia are being lost as humans change the landscape.
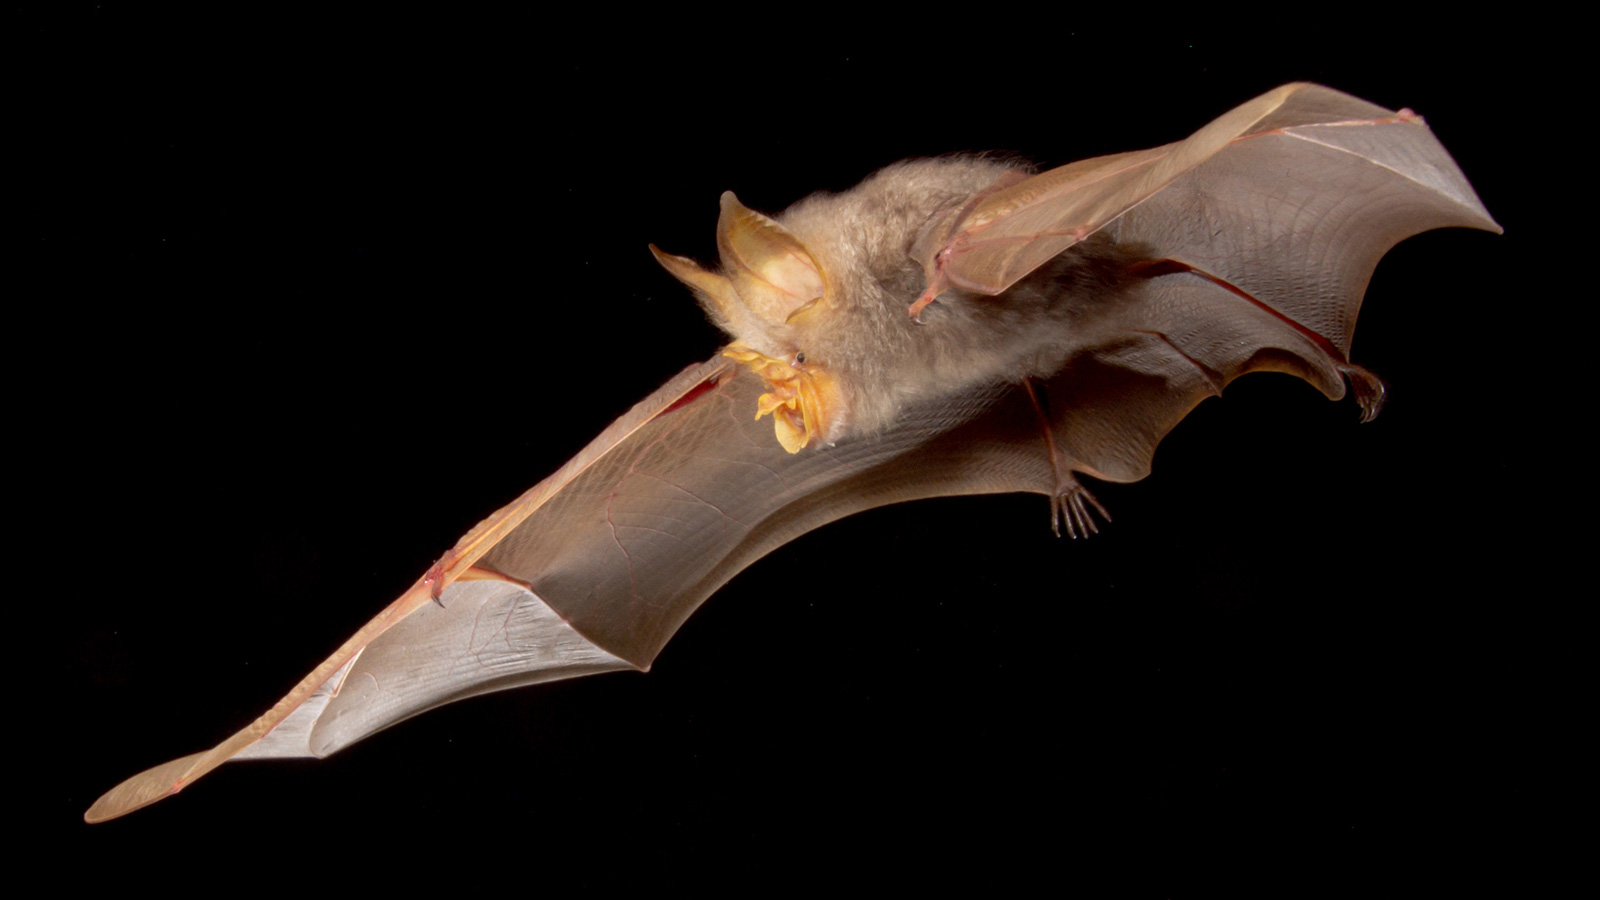
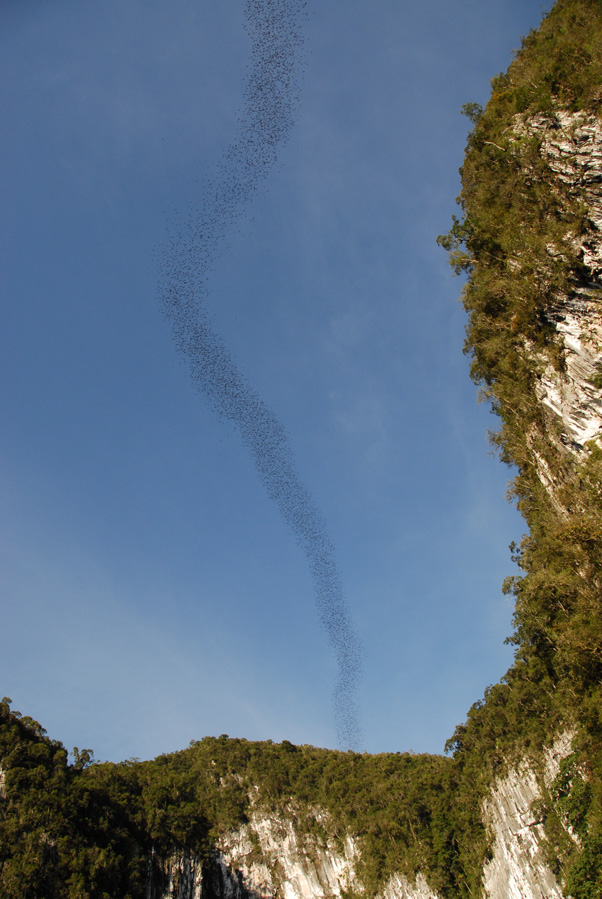
Waiting for pick up! Bats in the collecting bag of a harp trap set across a forest trail. You can see three of the four banks of fishing line and the bats hanging from the banks or side of the bag. Photo: Tigga Kingston CC BY-NC-SA 4.0The trefoil horsehoe bat in flight. A solitary species, they usually hunt from a perch above a small clearing in the forest understory, flying out to catch passing insects before returning to their perch to eat it. Photo: Charles M. Francis CC BY-NC-SA 4.0Wrinkled-lipped bats stream out of Deer Cave in Gunung Mulu National Park, Sarawak. It takes nearly an hour for the 3 million bats to leave and they will eat tonnes of crop pests each night. Photo: Tigga Kingston CC BY-NC-SA 4.0
The problem on everyone’s mind right now is of course Covid-19. Bats do not spread Covid-19, you can only catch it from other people. So why all the talk about bats?
The first trap starts us off well. It has two of my favourites – the trefoil horseshoe bat and clear-winged woolly bat. The trefoil horseshoe bat is a very handsome fellow – bats of this species roost on their own under palm or rattan leaves and have tan-coloured wings, long fluffy grey fur, yellow ears, elbows and knees and wonderful yellow noseleaf.
Horseshoe bats blast out their echolocation calls through their nostrils and use their noseleaf, a structure around their nose, to help focus the sound beam as they search for insects.
Julie carefully gets the bat out of the trap. He will be a good candidate for the obstacle course she has devised to see how well different bat species fly through the dense forest of the understory. This helps us understand how different species will respond to changes in forest structure that result in fragmentation and timber extraction.
When Ain goes to get the woolly bat there is a surprise in store – it’s not one bat but three clustered together to make a fluffy ball with the odd foot and wing sticking out! We’ve seen this before – the species lives in small social groups and roosts in clusters of dead leaves or old hanging bird nests.
In the middle of the ball of fluff, noses, feet and wings is a pup, firmly attached to the mother’s nipple. Ain is thrilled, mothers need a lot of energy to produce milk for their pups, so it’s important that they give birth when there are many insects around. We are worried that climate change may alter patterns in insect availability, depriving mothers of food when they need it most, and reducing breeding success.
By the time we have finished checking all 10 traps we have captured 30 bats of 15 species. All told, the rainforest of Krau Wildlife Reserve is home to the highest known diversity of bats in the Old World with at least 72 species. About 60 of the species are strictly insect-eating, and many of them are forest specialists.
The problem on everyone’s mind right now is of course Covid-19. Bats do not spread Covid-19, you can only catch it from other people. So why all the talk about bats?
SARS-CoV-2 is the virus that causes the disease Covid-19 in people. A virus related to SARS-CoV-2, called RatG2013, was isolated from an intermediate horseshoe bat from China in 2013, and that led to suggestions that perhaps the bat virus jumped from bats to people.
There has been a flurry of research since, and now we know this is extremely unlikely for a couple of reasons.
First, the key part of the virus that enables it to infect people is not from bats. The closest match identified so far is from a pangolin, but other wildlife may be involved. Second, although the human virus (SARS-CoV-2) and bat virus (RatG2013) are very closely related, recent work suggests they separated from one another 40-70 years ago. This means that it is not possible for the human virus to have come directly from the virus circulating in the intermediate horseshoe bats in 2013, other hosts must be involved.
A great diversity of viruses can be found in all wildlife, but spillovers – in which the virus jumps from animals to humans – have historically been rare because many conditions must align for spillover to be possible.
What is becoming very clear is that human activities are making these conditions possible more often. Habitat disturbance and destruction stress animals making them susceptible to viruses and more likely to produce high numbers of viruses.
Humans are encroaching on wildlife habitat or trading, butchering and consuming wildlife, all of which increases human exposure. Humans bring species together in markets and farmlands increasing opportunities for cross-species transmission that is often a key step towards human infection.
As a result of these human activities, we are seeing more spillover events, sometimes with deadly pandemic consequences. The solutions are simple and familiar – we must protect and restore habitats, stop exploitation of wildlife, and keep the worlds’ wildlife and ecosystems healthy.
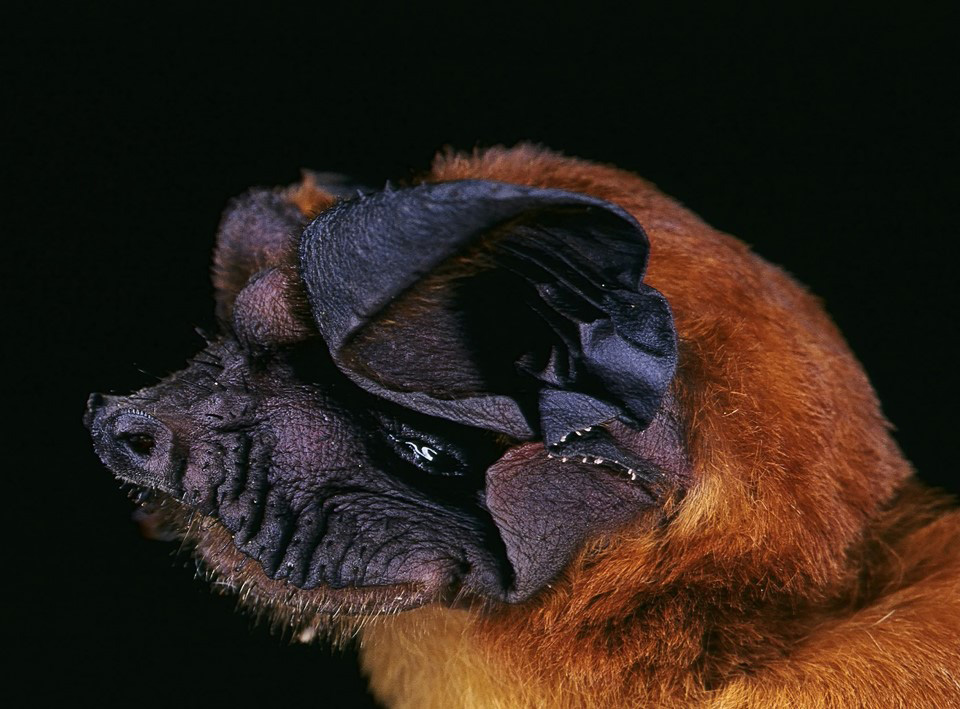
This portrait of a wrinkle-lipped bat makes it clear how they get their name. We aren’t sure why he’s such a lovely foxy red colour, but its common in older cave-dwelling bats. Photo: Tigga Kingston CC BY-NC-SA 4.0
As mentioned, loss of habitat is just one challenge facing Southeast Asia’s bats. About half the region’s bats roost in caves, but these are not the peaceful refuges they once were. Tourism, harvesting of guano and cave swiftlet nests, people just hanging out– all can disturb bats at roosts.
Many of the cave systems in Southeast Asia are made up of limestone and quarried by the cement industry resulting in total loss of cave roosts. Intense hunting of some species, particularly the large fruit bats, or “flying foxes”, for consumption or a perceived medicinal use is pushing many species to the brink of extinction.
Demand for large fruit bats is so great in Indonesia’s North Sulawesi that populations have been wiped out in the north and bats are being hunted and shipped from other provinces of Sulawesi and nearby islands to meet demand– as many as 500 tonnes per year. Fifty years ago, similar hunting levels on the Pacific island of Guam drove the island’s flying fox species, found nowhere else in the world, to extinction and decimated populations of another nine species from nearby islands.
The reason that hunting has such a big impact is because bats are very like us in many ways. They are long-lived mammals, particularly for their size, with some species living more than 30 years. Most species only give birth to one pup a year, and large species like the flying foxes typically don’t start to breed until their second or even third year. This means that populations are very slow to recover losses and can’t withstand sustained disturbance or intense hunting.
Land-use change, widespread hunting and destruction of roosts threaten 24% of Southeast Asia’s species but the conservation status and population trends for many species are unknown. This is tragic because Southeast Asia is such an extraordinary region for bats – a bat diversity hotspot home to over 400 species. That’s about 28% of all the world’s 1400 bat species in just 11 countries!
For a long time, very little was known about the region’s bat diversity, with just a handful of dedicated researchers active, but over the last 10-15 years more researchers are training in bats and have come together to form a multinational network – the Southeast Asian Bat Conservation Research Unit (SEABCRU) – to exchange information and work together across borders.
There have been lots of exciting discoveries as a result, including the description of 40 species new to science in just the last 12 years – a rate of discovery that suggests that there are lots more species still to describe. How tragic it would be to lose species because of habitat loss before we have even found and described them.
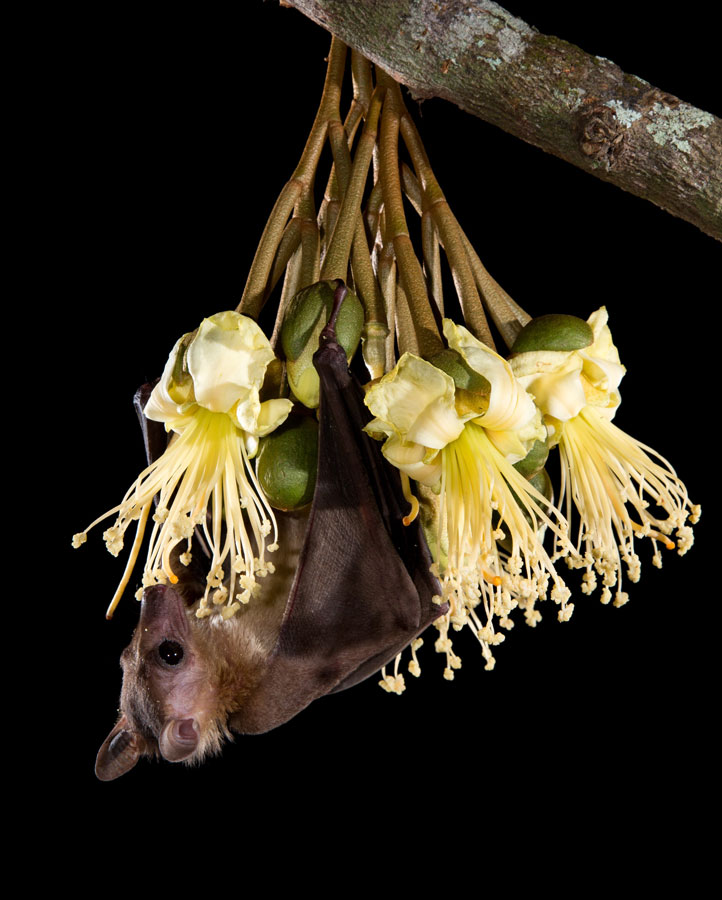
Researchers in the SEABCRU have shown just how important bats are for humans, particularly for ecosystem health and human food security. Bats are important pollinators and seed dispersers of hundreds of ecologically and economically important plants. Most famously they are the key pollinator of the King of Fruits itself, durian. Durian is an $18 billion dollar industry, but no bats means no durian!
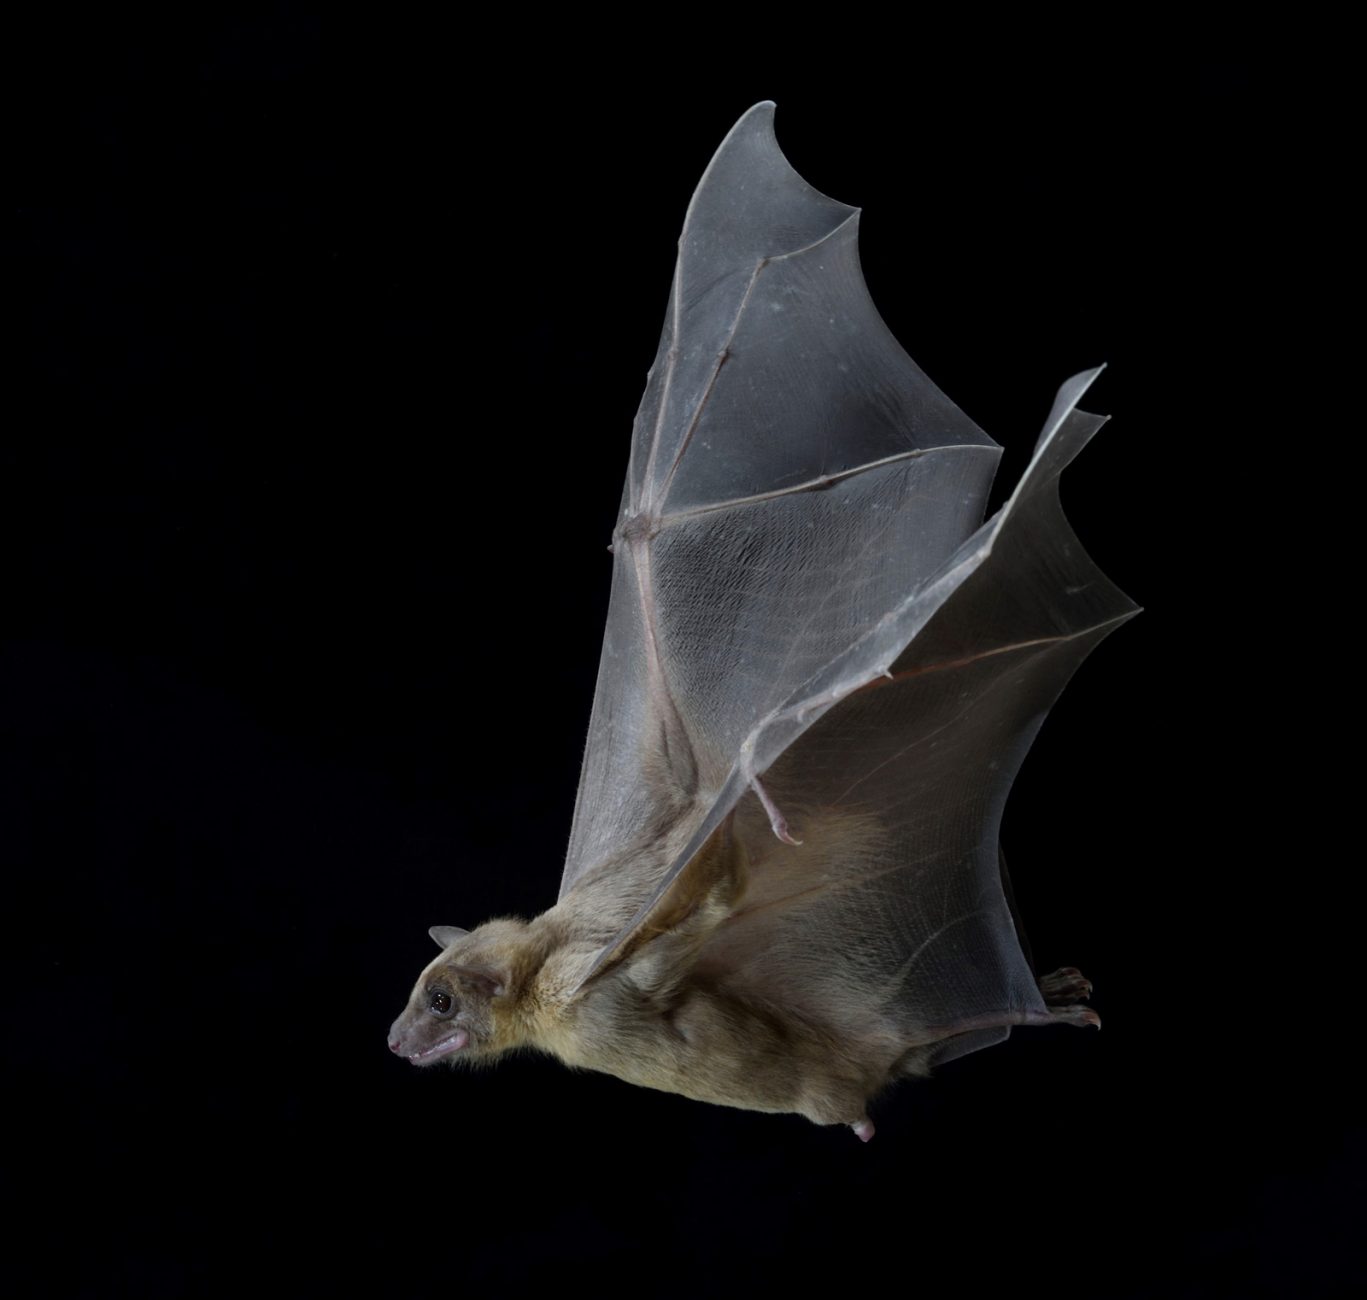
Bats are the only mammals that can truly fly rather than glide. Their scientific name – Chiroptera – means “handwing”. In this beautiful Egyptian fruit bat you can see how the wing is made of a thin layer of skin is stretched out over the elongated fingers bones of the “hand”. Photo:Sherri and Brock Fenton CC BY-NC-SA 4.0
Dr Sara Bumrungsi and his students at Prince of Songkla University in Thailand have calculated that in southern Thailand alone, the services of just one species, the dawn cave bat, in pollinating durian and petai (another regional favourite) is worth around USD $12 million a year.
As their name suggests, cave dawn bats roost in colonies of thousands to tens of thousands in caves, but there are disturbing reports that numbers across Southeast Asia are declining as caves are lost to disturbance and limestone extraction, and populations hunted.
The wrinkle-lipped free-tailed bat is another colonial species that roosts in caves in the thousands and even millions. Each night, thousands of bats stream out of their caves and zoom out across the landscape, travelling tens of kilometres on some nights in pursuit of insects. Among their favorite foods are plant-hoppers – one of the biggest pests of rice crops in Southeast Asia.
One colony in Thailand of 2.6 million bats eats about four tonnes of these pests in a single night, and across Thailand this one species saves the country about 2892 tonnes of rice annually – that’s 26,000 rice meals! Of course, everything that bats are doing that benefits us, they also do in the forests and natural landscapes of the region, ensuring that bat-dependent trees are pollinated, seeds are dispersed, and insect populations suppressed.
It’s 11pm and Julie, Ain and I have just finished processing our 30 bats. Each bat was identified to species, sexed, and the length of its forearm and body mass recorded. We put numbered bands on their forearms so we can recognise individuals if we catch them again in coming years and learn how long they live, and how they move around the forest.
Ain found that most of the females were either pregnant or lactating – we are in the breeding season. The trefoil horseshoe bat did a so-so job on Julie’s flight obstacle course (a series of vertical strings), but the woolly bats skipped through as though there was nothing there. We take each bat back to the trap it was caught in for release.
This is one of the best parts of the night, so we share the bats out evenly, although, as the boss, I always get the trefoil horseshoe bats. I gently put my hand at the edge of the trefoil’s bag and open it up. After a bit of scrabbling, his feet latch onto my finger and I draw him out.
He hangs from my finger and scans the area with echolocation calls too high for us to hear. He’s not blind but lives in a world made of echoes. Satisfied, he silently launches from my finger and flies into the night.
Many people are under the impression that all bats carry diseases that could pose threats to humans. This concern has recently increased because a virus hosted by one bat species seems to be a distant relative of SARS-CoV2. There have been many studies suggesting that because of their ability to fly, unique immune systems, and colonial nature, bats are special reservoirs for zoonotic pathogens— organisms that cause disease and are naturally transmitted between animals and humans. However, a recent study showed that when we account for species richness (i.e. the number of species in an evolutionary group), bats are no more likely to transmit zoonotic viruses than other groups of mammals. In other words, it is likely there are many viruses hosted by bats simply because there are many species of bats, not because they are more inherently dangerous to humans than other groups of mammals. Although this may not sound very comforting given that the world is dealing with a deadly virus, killing bats is not the solution to preventing outbreaks of zoonotic diseases.
Can we prevent a future outbreak by reducing bat populations that might host viruses? There is no evidence that bat culls prevent or diminish disease transmission. In fact, we might produce the opposite effect. For example, attempts to reduce vampire bat colonies in Peru resulted in higher rabies transmission in the bats left behind because culls skewed populations towards juveniles (which are more likely to transmit rabies). Similarly, putting bats in peril of extinction may further increase the number of viruses they can host. Some bats considered Near Threatened or Vulnerable by the International Union for the Conservation of Nature (IUCN) had higher viral richness than bats considered of Least Concern. Based on all currently available evidence, killing bats does not have any benefit for disease management.
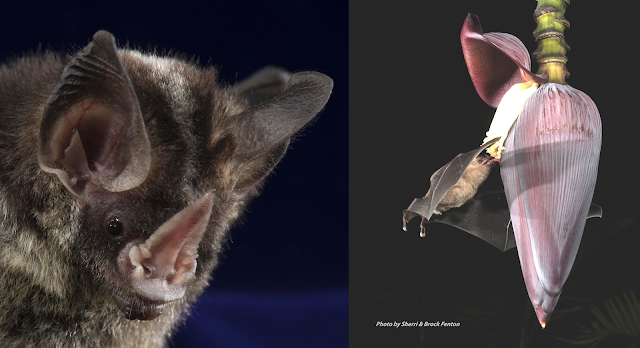
Headshot of a striped Keenan’s bat (Gardnerycteris keenani), a South and Central American species that feeds on insects (left). Pallas’s long-tongued bat (Glossophaga soricina), a South and Central American species that feeds on nectar, such as that of the banana flower in the photo (right). Photos by Sherri & Brock Fenton.
Bats provide more benefits to our everyday lives than we can imagine, and decreasing their populations would have rippling effects on agriculture and natural ecosystems. Bats provide millions of dollars in free pest control services all over the world and pollinate many plants cultivated by humans, including tequila agaves, mangos, and durians. Bats can also help us in the fight against global deforestation and climate change by dispersing seeds and helping to regenerate the rainforests. Losing bats would hurt humans more than it could ever protect us, so in order to protect ourselves, we need to realize the value of protecting bats.
So how can we prevent new pathogen spillovers from bats to humans? Part of the answer lies in changing our own behaviors and the ways we interact with the natural world. One way we can change behaviors is by providing people with accurate, consistent information about avoiding contact with disease reservoirs. Since all vertebrates naturally host viruses and bacteria, avoiding situations where pathogens might be amplified or transferred is most important. In the case of hantavirus, a serious respiratory illness transmitted by rodents, disease transmission has been curbed through educational outreach encouraging people to avoid rodent urine and refrain from sweeping in areas with rodent droppings, since sweeping causes viral particles to become airborne. The number of viruses circulating in bat populations may even be influenced by outside factors including many human activities. For example, deforestation and the presence of humans in Western and Central Africa have been linked to the occurrence of fruit bats that tested positive for Ebola virus antibodies. These regions overlap with known Ebola outbreak areas, suggesting that the more humans encroach on bat habitats, the higher the risk for viral spillovers. To prevent the next pandemic, we need to take decisive action to stop encroaching on wild spaces and protect more lands and habitats. Actions forming and preserving natural and artificial buffers between humans and wildlife will be critical to protecting human health as well as wildlife health.
Identifying whether novel human viruses disproportionately originate from certain animal groups could inform risk-based allocations of research and surveillance effort. Whether such “special reservoirs” exist remains controversial. We show that the proportion of viruses that infect humans varies minimally across reservoir taxonomic orders. Instead, the number of human-infecting viruses increases proportionately to the total number of viruses maintained by each reservoir group, which is in turn explained by the number of animal species within each group. This supports a host-neutral explanation for observed variation in the number of zoonoses among animal groups, such that traits of animal orders are unlikely to produce viruses that disproportionately threaten humans. These findings refine strategies to identify high-risk viruses prior to their emergence.
Abstract
The notion that certain animal groups disproportionately maintain and transmit viruses to humans due to broad-scale differences in ecology, life history, and physiology currently influences global health surveillance and research in disease ecology, virology, and immunology. To directly test whether such “special reservoirs” of zoonoses exist, we used literature searches to construct the largest existing dataset of virus–reservoir relationships, consisting of the avian and mammalian reservoir hosts of 415 RNA and DNA viruses along with their histories of human infection. Reservoir host effects on the propensity of viruses to have been reported as infecting humans were rare and when present were restricted to one or two viral families. The data instead support a largely host-neutral explanation for the distribution of human-infecting viruses across the animal orders studied. After controlling for higher baseline viral richness in mammals versus birds, the observed number of zoonoses per animal order increased as a function of their species richness. Animal orders of established importance as zoonotic reservoirs including bats and rodents were unexceptional, maintaining numbers of zoonoses that closely matched expectations for mammalian groups of their size. Our findings show that variation in the frequency of zoonoses among animal orders can be explained without invoking special ecological or immunological relationships between hosts and viruses, pointing to a need to reconsider current approaches aimed at finding and predicting novel zoonoses.
Most emerging infectious diseases of humans are viruses that originate from nonhuman animals via “zoonotic” transmission (1⇓–3). Given the diversity of animals and viruses in nature, targeting virus discovery, surveillance, and research toward the taxonomic groups with the highest propensity to infect humans would benefit attempts to mitigate future disease outbreaks (4⇓⇓–7). Identifying these groups remains a major challenge. Viruses with RNA genomes are overrepresented as zoonoses and certain families including Filoviridae, Orthomyxoviridae, and Togaviridae contain a large proportion of zoonotic species (8, 9). Among hosts, however, patterns are less clear. Large-scale comparative studies have suggested that barriers to cross-species transmission increase with evolutionary divergence from humans, implying heightened zoonotic risk from closely related nonhuman primates (9, 10). Yet, other animal groups including bats, rodents, and ungulates are also frequently associated with zoonoses despite their evolutionary distance from humans (9, 11⇓–13). A popular explanation (here, the “special reservoir hypothesis”) is that physiological or ecological traits of these taxa make them more likely to maintain zoonotic viruses or transmit them to humans. For example, ungulates and rodents include domesticated or anthropophilic species whose high ecological overlap with humans could facilitate pathogen exchange (13, 14). In contrast, the unique life history of bats has been hypothesized to create an evolutionarily distinct immunological environment that selects for viral traits that favor human infection (15⇓⇓⇓⇓–20). An alternative to the special reservoir hypothesis is that host species maintain a similar number of viruses with a similar per-virus risk of zoonotic transmission. Variation in the number of zoonoses among animal groups therefore arises as a consequence of their species richness (here, the “reservoir richness hypothesis”). For example, the preponderance of rodent- or bat-associated zoonoses could reflect the large number of rodent and bat species relative to other mammalian groups (21). These hypotheses imply different management strategies. The special reservoir hypothesis would advocate fundamental research to define the ecological or physiological trait profiles that explain the propensity of certain hosts to harbor zoonoses, followed by targeted surveillance or virus discovery in hosts with high-risk trait profiles. In contrast, the reservoir richness hypothesis would advocate broader surveillance and virus discovery, possibly proportionate to the local species richness of different animal groups, and would imply the need for deeper understanding of which features of virus biology enhance zoonotic transmission.
Identifying patterns in the animal origins of zoonoses has been frustrated by disconnects between the key outcome of interest, the likelihood of zoonotic transmission, and currently available data which document viral infection in human and nonhuman hosts but provide limited information on the origins of these infections. For example, humans may infect nonhuman hosts, rather than the other way around, but only the latter direction of transmission is pertinent to zoonotic origins. A greater challenge is that the reservoir host species that maintain and transmit viruses to humans can rarely be distinguished from species that form a larger community of “dead-end” hosts that are inconsequential to transmission (22, 23). Rather than reflecting genuine imbalances in the animal origins of human infections, associations between certain animal groups and zoonotic viruses based on shared detections might instead emerge from heightened surveillance for or susceptibility to zoonotic viruses in these groups even if they are not key components of natural transmission cycles. As the known diversity of viruses expands, the increasing difficulty of differentiating related viruses in different host species from the same virus transmitted between these host species would exacerbate this effect by overestimating viral sharing, particularly if relying on serological or PCR data alone (24).
Given this uncertainty in the reservoir hosts of most viruses at the species level, an alternative approach to resolving whether animal host associations influence zoonotic risk would be to assess reservoir associations at lower taxonomic resolutions. Such analyses would take advantage of the tendency for viruses to be maintained by host species within the same taxonomic order, a phenomenon which arises from more frequent host shifting among closely related species and the cospeciation of hosts and viruses (25⇓–27). At this coarser taxonomic level, transmission cycles may be accurately defined for hundreds of viruses, enabling a test of host effects predicted by the special reservoir hypothesis (e.g., applying to animal orders such as Chiroptera or Rodentia) that is robust to reservoir species uncertainty. Further, condensing reservoir–virus associations to a single observation per virus would enable statistical approaches that separate confounding effects of virus and host taxonomy that arise from the nonrandom distribution of virus families with differing zoonotic propensity among reservoir groups. These models could also account for additional factors including differential research effort among host and virus groups and the phylogenetic proximity of animal hosts to humans that are suspected to vary with zoonotic transmission (9, 28).
Results
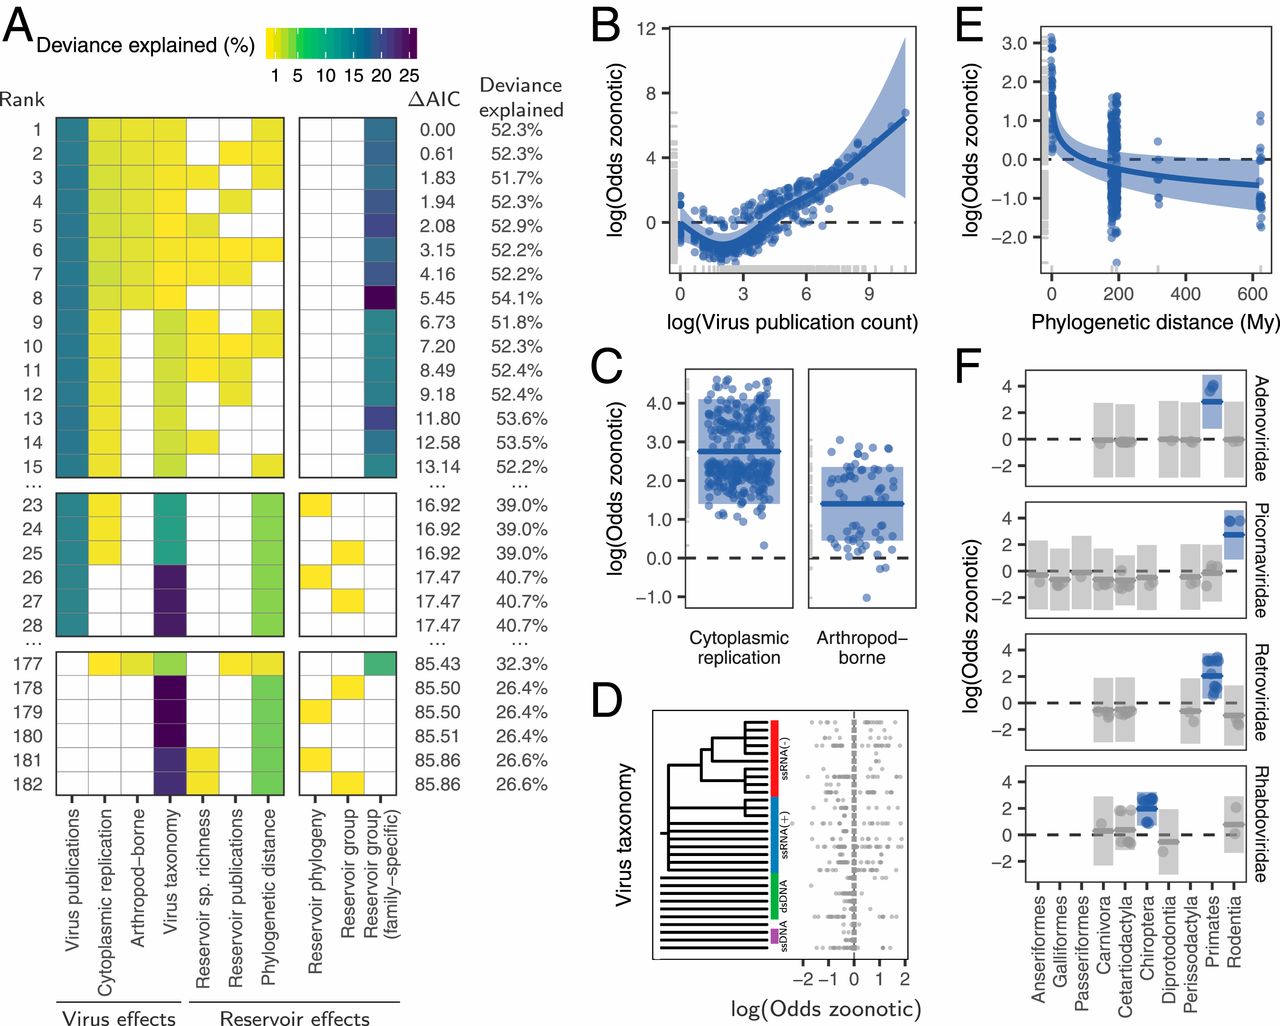
We used literature searches to expand an existing dataset of the maintenance cycles of single-stranded RNA viruses (27) to include all 35 RNA and DNA virus families infecting birds and mammals, the hosts that account for the vast majority of zoonoses (8). From a total of 673 virus species, 415 species from 30 families had compelling evidence for transmission by one or more of the 11 taxonomic orders of nonhuman reservoirs (three avian, eight mammalian) which met our inclusion criteria (Materials and Methods). When possible, viral species linked to more than one reservoir group were subdivided into reservoir order-associated viral clades (n = 11 species), and otherwise excluded (n = 2), creating a final dataset of 429 reservoir–virus associations. Data on zoonotic status (i.e., whether a virus had been reported to transmit from nonhumans to humans) were obtained from Olival et al. (9), Woolhouse and Brierley (29), and primary literature searches. We found dramatic variation in the number and diversity of viruses across reservoir groups (Fig. 1). Cetartiodactyls and rodents were the most common reservoirs in our dataset, together accounting for half of the included viruses (50.6%), while anseriforms (waterfowl) were the most poorly represented, with only 1.4% of viruses (Fig. 1A). We quantified the degree of skew in viral diversity among groups of reservoirs using a sliding metric which places varying amounts of emphasis on rare viral lineages (30), here defined as those virus taxonomic lineages that were rarely found in the focal reservoir order. Despite harboring substantial viral species richness, the taxonomic distribution of viruses was notably skewed for some host groups (Fig. 1B). The majority of primate and rodent viruses fell in two to three viral families and the remaining viruses were scattered across families that contained few other species infecting these host groups (on average, two species; Fig. 1 A and B). Other groups including carnivores and odd-toed ungulates had smaller, but more balanced, viral communities (Fig. 1B). Both the number and the proportion of zoonotic virus species appeared to differ among reservoir groups, although the 95% CI of proportions overlapped in most cases (Fig. 1C). The taxonomic distribution of zoonoses within host groups was highly skewed (Fig. 1A). For example, 50% of zoonotic bat viruses were rhabdoviruses and 53.7% of zoonotic rodent viruses were hantaviruses or arenaviruses, reinforcing the need to account for virus taxonomy to avoid detecting effects of reservoirs on zoonotic status that would be unlikely to generalize across bat or rodent viruses (SI Appendix, Fig. S1).
Fig. 1. Species richness and diversity of viruses associated with major reservoir host groups. (A) The distribution of virus families across mammalian and avian reservoir orders. Each rectangle represents a reservoir–virus family combination, with size corresponding to the number of virus species linked to that reservoir and color indicating the proportion of these viruses which are zoonotic. Viral families are abbreviated as follows: Ade = Adenoviridae, Are = Arenaviridae, Art = Arteriviridae, Asf = Asfarviridae, Ast = Astroviridae, Cal = Caliciviridae, Cir = Circoviridae, Cor = Coronaviridae, Fil = Filoviridae, Fla = Flaviviridae, Hepa = Hepadnaviridae, Hepe = Hepeviridae, Her = Herpesviridae, Nai = Nairoviridae, Ort = Orthomyxoviridae, Pap = Papillomaviridae, Para = Paramyxoviridae, Parv = Parvoviridae, Per = Peribunyaviridae, Phe = Phenuiviridae, Pic = Picornaviridae, Pne = Pneumoviridae, Pol = Polyomaviridae, Pox = Poxviridae, Reo = Reoviridae, Ret = Retroviridae, Rha = Rhabdoviridae, Tob = Tobaniviridae, and Tog = Togaviridae. (B) The taxonomic diversity of viruses maintained by each reservoir, at decreasing levels of sensitivity to rare lineages as the q-parameter increases. (C) The number and proportion of virus species associated with each reservoir which are zoonotic; error bars show 95% binomial CIs calculated using the Wilson method
We next used generalized additive mixed models with zoonotic status as a binary response variable to identify and rank the host and/or viral traits that influenced the zoonotic status of viruses. When ranking models using the Akaike information criterion (AIC), the top model explained a total of 52.3% of deviance in zoonotic status (Fig. 2A). This model contained several previously reported effects of viral biology, including transmission by arthropod vectors and exclusively cytoplasm-based replication, which increased the odds of being zoonotic 4.1-fold (log odds = 1.40) and 15.7-fold (log odds = 2.75), respectively (Fig. 2C). However, neither explained >2.2% of the deviance (Fig. 2A). Zoonotic viruses also tended to be more studied, with the number of publications associated with each virus species explaining 15.2% of the deviance (Fig. 2B).
Fig. 2. Reservoir host and virus predictors of zoonotic propensity. (A) Top 15 models ranked by AIC, along with the top models not containing a virus-family specific effect (ranked 23rd to 28th), and the top models not containing an effect for virus publication count (ranked 177th to 182nd). Rows represent individual models and columns represent variables. Cells are shaded according to the proportion of deviance explained by each effect; effects not present in particular models are indicated in white. The final three columns represent different versions of a potential “special reservoir effect” and were not allowed to cooccur in the same model. (B–F) Effects present in the top model. Lines indicate the predicted effect of each variable, when keeping all other variables at either their median observed value (when numeric) or their most common value (when categorical). Shaded regions indicate the 95% CIs of predictions, while points indicate partial residuals after accounting for all variables in the model except the one on the x axis. Effects whose 95% CI cross zero over the entire range of the predictor variable are shaded in gray. Phylogenetic distance (E) was measured as cophenetic distances, which describe the total evolutionary distance from each group to primates. Note that only the subset of virus families which include significant effects (i.e., those showing no overlap with 0) are illustrated in F (see SI Appendix, Fig. S2 for all families).
Among effects related to reservoir hosts, zoonotic risk declined with greater phylogenetic distance from reservoirs to primates, but this effect explained only 0.7% of the deviance in the top model and was absent from other competitive models (Fig. 2 A and E). Effects of reservoir order or phylogeny (either alone or crossed with an effect of virus family-level taxonomy) did not occur until the 23rd-ranked model, where they explained <0.01% of the deviance (ΔAIC from top model >16.9; Fig. 2A). The only strongly supported models containing an effect of reservoir host restrained the effect to certain viral families (i.e., a random effect of reservoir nested within virus family, here termed the “virus family-specific reservoir” effect). This effect explained 20.7% of the deviance in zoonotic status in the top model. In particular, primate adenoviruses and retroviruses, bat rhabdoviruses, and rodent picornaviruses were more likely to be zoonotic relative to viruses from the same families associated with other reservoirs (Fig. 2F). Critically however, none of these reservoir groups increased zoonotic propensity across additional viral families, suggesting the absence of generalizable effects of reservoir group on the likelihood of zoonotic transmission (Fig. 2A and SI Appendix, Fig. S2).
We further evaluated whether effects of reservoir hosts on zoonotic status might have been missed due to the inclusion of potentially collinear variables or insufficient statistical power to fit complex models. First, given that study effort understandably increased for zoonotic viruses, including this factor might have disguised true reservoir effects. However, models which did not adjust for virus-related publication counts failed to support reservoir effects; the best of such models achieved similar AIC values with and without reservoir effects (models 177 to 182, Fig. 2A). Second, including virus taxonomy might have reduced the power of our models. However, reservoir effects remained negligible or absent in models which excluded viral taxonomy (SI Appendix, Fig. S3). In contrast, viral family effects were robust to inclusion of general reservoir effects (i.e., those testing for consistent reservoir effects across viral families). When the family-specific reservoir effect was not present, viral rather than reservoir taxonomy was the stronger predictor of zoonotic status (models 23 to 28 in Fig. 2A and SI Appendix, Fig. S3). Thus, our results provide no support for the special reservoir hypothesis, which predicted that viruses associated with certain reservoir groups would be more likely to be zoonotic.
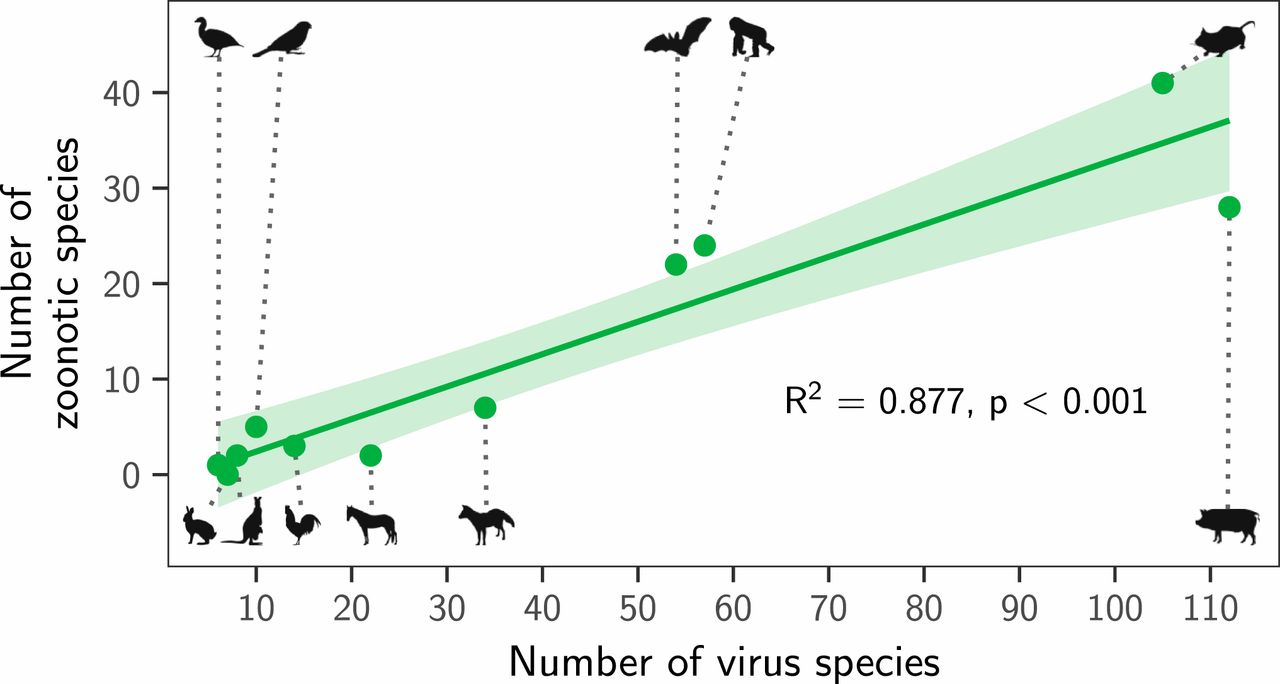
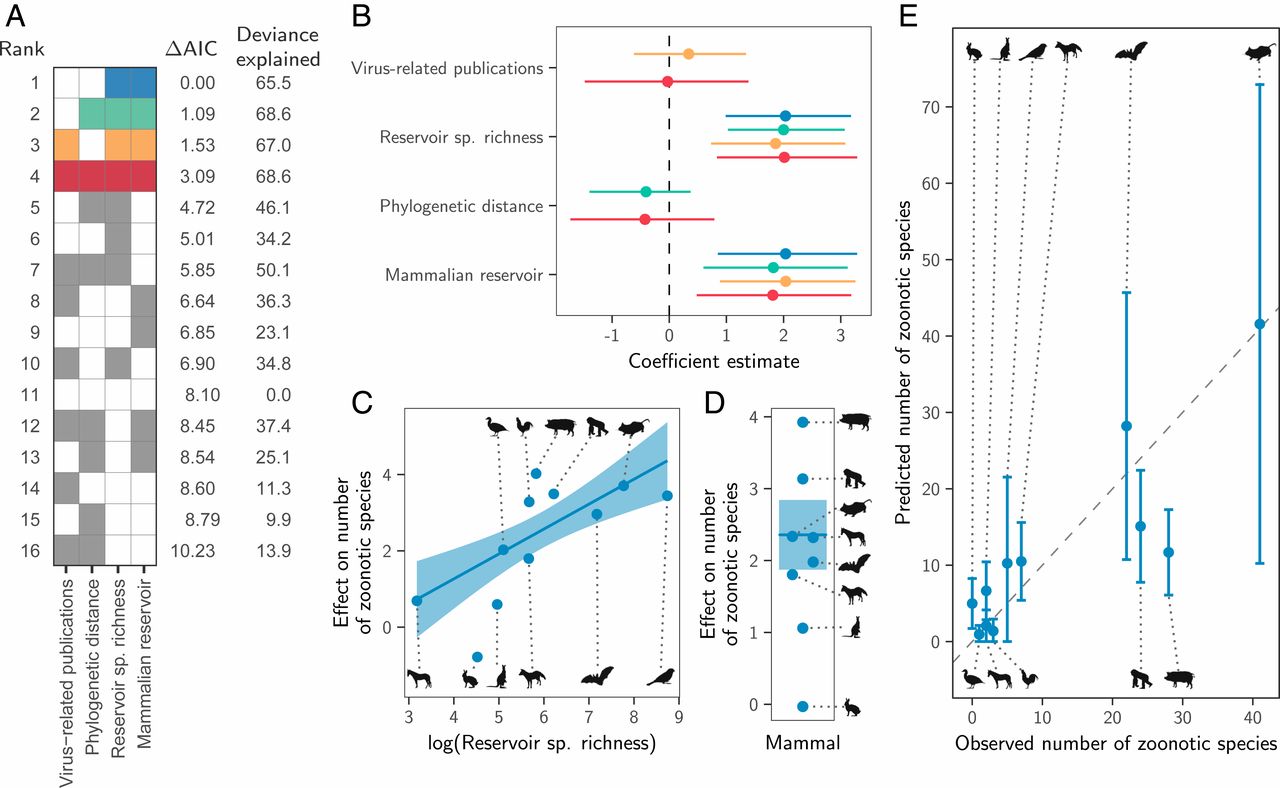
Instead, both the total number of viruses associated with each reservoir group (“viral richness”) and the number of zoonoses matched expectations under the reservoir richness hypothesis. The absence of reservoir effects meant that viral richness was strongly correlated with the number of zoonotic species (R2 = 0.88, P < 0.001; Fig. 3), consistent with a similar per-virus zoonotic risk across reservoirs. Notably, a similar correlation was previously observed when measuring viral richness at the host species level (9). A series of negative-binomial generalized linear models showed that—after controlling for greater viral richness in mammals compared to birds—reservoir species richness was correlated with both the number of zoonotic viruses (65.5% of deviance) and the viral richness (56.4% of deviance) of different reservoir orders (Fig. 4 and SI Appendix, Fig. S4). These models outcompeted those including previously identified effects of virus-related research effort and the phylogenetic distance of each reservoir group from primates (9), which when included explained a maximum of 3.1% additional deviance (ΔAIC ≥ 1.09; models 2 to 4 in Fig. 4A). Exchanging the reservoir class effect (i.e., birds versus mammals) for phylogenetic distance to primates performed considerably worse than the top model (ΔAIC = 4.72; model 5 in Fig. 4A). Similar results were observed for models predicting total viral richness (SI Appendix, Fig. S4).
Fig. 3. Relationship between the number of virus species and the number of zoonotic species maintained by each reservoir group. The line shows a linear regression fit, with its 95% CI indicated by the shading.Fig. 4. Factors predicting the number of zoonotic virus species across animal orders. (A) Models for all possible variable combinations ranked by AIC. Each row represents a model, while columns represent variables. Filled cells and white cells indicate variable inclusion and absence, respectively. The top four model are color-coded, with colors reused in all other panels to identify the respective models. (B) Coefficient estimates for the top four models; points indicate the maximum likelihood estimate and lines show 95% CIs. All variables were scaled by dividing them by 2 times their SD, meaning coefficients are directly comparable as effect sizes. (C and D) Partial effect plots for variables in the top model. Lines and shading indicate the partial effects and 95% CIs, with points showing partial residuals. (E) Predicted number of zoonotic viruses for each reservoir group when using the top model (blue in A; see SI Appendix, Fig. S5 for other top models).
We next assessed how well the predictions of the reservoir richness model matched observations in individual reservoir groups. Highly recognized mammalian reservoir groups including bats and rodents hosted close to the number of zoonoses expected from their species richness (bats: 22 observed and 28 predicted [95% CI: 10.7 to 45.7]; rodents: 41 observed and 42 predicted [95% CI: 10.2 to 72.9]; Fig. 4E). In contrast, lagomorphs (rabbits, hares, and pikas) and diprotodonts (an order of marsupials) hosted both fewer viruses and fewer zoonoses than predicted; however, these were among the least-studied animal groups (Fig. 4E and SI Appendix, Fig. S4E). The only potentially “special” reservoirs identified by this analysis were the cetartiodactyls (even-toed ungulates and whales) and primates, which hosted more zoonoses than would be predicted for mammalian groups with their species richness (Fig. 4E). In the case of primates, this likely reflects the higher zoonotic propensity of primate-borne adeno- and retroviruses identified above (24 zoonotic viruses observed, of which 3 are adenoviruses and 7 are retroviruses; 15 predicted [95% CI: 7.8 to 22.4]). The mismatch was greater for cetartiodactyls (28 observed, 12 predicted [95% CI: 6.1 to 17.3]). However, perhaps due to their close association with humans as domestic livestock, this group also had considerably higher total viral richness than predicted (112 observed and 45 predicted [95% CI: 25.3 to 65.5]; SI Appendix, Fig. S4E). Consequently, the proportion of cetartiodactyl viruses which were zoonotic was unexceptional, inconsistent with the special reservoir hypothesis (Figs. 1 and 3). Strikingly, although mammals had elevated viral and zoonosis richness compared to birds, the proportion of zoonotic viruses was similar between classes, with 9/30 of avian and 115/387 of mammalian virus species being zoonotic (30% and 28.8%, respectively), emphasizing that—regardless of the cause—it is the underlying number of virus species which differs between mammals and birds, not the zoonotic component.
Discussion
Animal groups have been proposed to differ in their propensity to transmit viruses to humans as a consequence of variation in their life history, physiology, or ecology. By combining a large dataset of reservoir host–virus associations with records describing their histories of human infection, our analysis found no evidence that the taxonomic identity of reservoirs affects the probability that the viruses they harbor are zoonotic. Instead, variation in the number of zoonoses maintained by each reservoir group was consistent with a largely host-neutral model, whereby more species-rich reservoir groups host more virus species and therefore a larger number of zoonotic species. These findings imply the need to reconsider some current approaches to virus discovery, surveillance, and research.
The absence of effects of reservoir host associations on the zoonotic status of viruses is at odds with the idea that conserved traits of certain host groups alter the zoonotic potential of their viruses. If host traits predictably altered zoonotic risk, these effects would be expected to act on multiple viral groups. Instead, we found that reservoir effects were isolated within individual virus families, such that no reservoir group altered the zoonotic risk of viruses across a broad range of viral families. For example, bats are widely considered special reservoirs due to their association with several high-profile zoonoses, including Severe acute respiratory syndrome-related coronavirus (Coronaviridae), Nipah henipavirus (Paramyxoviridae), and Ebola viruses (Filoviridae) (17, 19, 31). However, virus species within those families with a bat reservoir were no more likely to be zoonotic than those transmitted by other hosts, although we acknowledge that this effect would have been difficult to detect for filoviruses given the small number of virus species in this family. While our results do not dispute the existence of distinct features of bat immunity or life history which have been hypothesized to influence viral communities in bats (16, 18, 19, 32, 33), they provide no compelling evidence that these traits translate into an increased probability of bat-associated viruses infecting humans.
Idiosyncratic family-specific reservoir effects could reflect especially zoonotic clades within viral families that are strongly host-associated, sampling biases, or genuine interactions between the biological features of specific viral groups and specific reservoirs that increase zoonotic capability (e.g., differences in viral shedding or tissue tropism). Among rhabdoviruses, a significantly elevated proportion of bat-associated species were zoonotic, but this effect was driven by the rabies-causing genus Lyssavirus, which contained 73% of the 25 zoonotic rhabdovirus species and is strongly bat-associated (35). However, Rabies lyssavirus is also zoonotic when associated with carnivores and bat-associated Rhabdoviruses outside of the Lyssaviruses are not known to be zoonotic, suggesting that traits of this viral genus rather than its reservoirs are the underlying driver of the detected bat effect (SI Appendix, Fig. S3). The putatively heightened frequency of zoonotic rodent-associated picornaviruses might conceivably arise if transmission by rodents selects for viral traits that disproportionately promote zoonotic capability or if picornaviruses have similar zoonotic capability across reservoir groups but heightened ecological overlap favors zoonotic transmission from rodents. Yet, given that our dataset contained only three rodent-associated picornaviruses (all zoonotic) and primates and cetartiodactyls also hosted zoonotic picornaviruses (three out of four and one out of six zoonotic, respectively), a statistical artifact of low sample size cannot be ruled out. In contrast, effects of nonhuman primate reservoirs on the zoonotic potential of adenoviruses and retroviruses may have a biological basis. All primate-associated adenoviruses (three out of three) and 7 out of 12 primate-associated retroviruses were zoonotic, while none of the 15 adenoviruses and 16 retroviruses associated with other reservoirs have been reported to infect humans. This suggests that evolutionarily conserved similarities between nonhuman primates and humans may facilitate zoonotic transmission in these viral families. Yet, our results also highlight limitations of host phylogeny as a generalizable predictor of zoonotic capability since primate associations did not affect the zoonotic status in most of the viral families maintained by nonhuman primates. We hypothesize that the advantages conferred by phylogenetic relatedness are crucial for viral families that are inherently host-restricted (e.g., retroviruses, which must integrate into host genomes) but are less influential for viruses with less specialized infection and replication mechanisms. More generally, the relatively poor performance of phylogenetic distance in predicting either the proportion or the number of zoonoses from different reservoir groups (Figs. 2E and 4 A and B) suggests that the evolutionarily conserved factors that facilitate cross-species transmission within animal orders (25, 36, 37) are unlikely to extend over deeper evolutionary distances.
Our modeling framework allowed us to distinguish the relative contribution of host and virus features to zoonotic status. Consistent effects of viral taxonomy support the conclusion that zoonotic ability is a feature of viral clades rather than host associations (9, 28); however, the underlying viral trait determinants remain unresolved. As shown here (Fig. 2) and elsewhere, transmission by arthropod vectors and replication in the cytoplasm of host cells were linked to zoonotic transmission (9, 38). These findings are potentially explainable by selection for viral generalism arising from the need to replicate in both vertebrate and invertebrate hosts and the avoidance of the additional barriers associated with entering and replicating in the nucleus in novel host species, respectively. Yet, the site of viral replication within cells is invariant within viral families and arthropod-borne transmission is also strongly evolutionarily conserved (27, 39). Therefore, these traits have limited utility for explaining large variation in zoonotic risk within viral families. Identifying whether factors beyond ecological opportunity predict zoonotic status is vitally important to anticipate zoonotic transmission and to estimate the number of viruses which may emerge in the future.
The number of zoonoses scaled positively with the host species richness of animal orders (Fig. 4). Since reservoir species richness did not affect the probability that viruses were zoonotic (Fig. 2A), direct effects of species richness—which might occur if viral maintenance by more species rich host orders facilitates zoonotic transmission by selecting for broader host range—are unlikely (2). Instead, our results support a numerical, host species-neutral explanation: more species-rich animal orders maintain more viruses and hence more zoonoses. Indeed, after controlling for diminished viral richness in birds compared to mammals, key groups including bats and rodents harbored close to the number of zoonoses expected from their species richness (Fig. 4). These results mirror—and potentially explain—observations that the risk of zoonotic emergence is elevated in regions with high species richness (3, 40), since more virus species and hence zoonoses would be expected in species-rich habitats. More generally, our results suggest that the processes which shape viral richness (i.e., extinction, codivergence, and host shifts) do not vary enough among animal orders to create significant differences in the average number of viruses per species across reservoir orders. One implication of the relationship between reservoir species richness and the number of zoonoses is that surveillance efforts aimed at finding potential zoonoses should scale with the species richness of reservoir groups. This recommendation differs from the current practice which is based on the a priori expectation that certain groups (e.g., bats, rodents, and primates) are more likely to maintain zoonotic viruses (7). Analogously, our results underscore the challenges of identifying unknown reservoirs for viruses of importance to human health, since sampling effort would need to scale with local biodiversity, which itself may be uncertain.
Our dataset and analytical approach differed in several epidemiologically important ways from previous studies which suggested variation in viral zoonotic propensity across animal groups (9, 12). First, restricting virus–reservoir associations to the order level allowed us to test hypotheses on the role of broad animal groups on zoonotic origins in the face of widespread uncertainty in the identity of viral reservoirs at the host species level (22, 23, 27). This meant excluding human viruses that occasionally infect nonhumans and all associations between viruses and nonhuman hosts which are not currently considered to be important in natural transmission cycles. While it is conceivable that some excluded host–virus associations have an unrecognized role in transmission, adding 302 previously reported associations which did not meet our criteria did not qualitatively change our results (SI Appendix, Fig. S6). Second, we considered a single reservoir order for most viruses rather than modeling every association of each virus with each infected host species within that order independently. This was critical to avoid potentially spurious effects driven by surveillance effort and multiple observations of the same virus in closely related species. For example, Dengue virus (DENV) has been detected in at least 20 bat species, which comprise 76% of DENV–host associations (9, 12), but nonhuman primates, not bats, are the currently accepted reservoirs of zoonotic DENV outbreaks (41⇓–43). Our dataset therefore included a single primate reservoir since the majority of DENV–host associations would have obscured conclusions on zoonotic origins. Finally, unlike previous studies, we included avian viruses; however, restricting our analysis to mammalian viruses failed to recover reservoir host effects on zoonotic risk (SI Appendix, Fig. S7). One possible explanation for the apparent discrepancy between our findings and those based on shared virus detections could be that heightened surveillance for or susceptibility to zoonoses has led to elevated detections of spillover infections in previously identified “special hosts.” Our results highlight the importance of separating exposure and infection from transmission in future studies which involve reservoirs of infection.
A clear limitation of our approach was that we were unable to consider traits that vary within reservoir groups (e.g., reproductive rates, population size, and geographic range size) which may moderate the baseline zoonotic risk by altering viral richness, transmission dynamics, or ecological contacts of hosts with humans (44). In addition, even at the broad level of host taxonomy we used, knowledge of virus–reservoir relationships and zoonotic capability is incomplete and unevenly distributed among host groups (45). Analogous analyses of the capability of viruses to infect nonhuman hosts could also enable broader understanding of the determinants of cross-species transmission but will require constructing comprehensive datasets of infection histories in these alternative species. Finally, we evaluated only viral richness and whether viruses were reported to infect humans. Whether viruses from different reservoirs differ systematically in their pathogenicity, capacity to transmit among humans, or in their frequency of zoonotic transmission cannot be assessed from our data.
In summary, our analysis suggests that variation in the frequency of zoonoses among major bird and mammal reservoir groups is an emergent property of variation in host and virus species richness. We find no evidence that intrinsic or ecological differences among animal groups increases the number of viruses they maintain or the likelihood that any given virus is zoonotic. Basing public health surveillance and research strategies aiming to identify high-risk viruses on the assumption that some taxonomic orders of hosts are disproportionate sources of zoonoses risks missing important zoonotic viruses while simultaneously reenforcing patterns that may reflect detection biases rather than zoonotic risk.
Materials and Methods
Database Construction.
We studied 35 virus families listed as infecting animals in either Fields Virology or the ViralZone web resource (Adenoviridae, Anelloviridae, Arenaviridae, Arteriviridae, Asfarviridae, Astroviridae, Birnaviridae, Bornaviridae, Caliciviridae, Circoviridae, Coronaviridae, Filoviridae, Flaviviridae, Genomoviridae, Hantaviridae, Hepadnaviridae, Hepeviridae, Herpesviridae, Nairoviridae, Orthomyxoviridae, Papillomaviridae, Paramyxoviridae, Parvoviridae, Peribunyaviridae, Phenuiviridae, Picobirnaviridae, Picornaviridae, Pneumoviridae, Polyomaviridae, Poxviridae, Reoviridae, Retroviridae, Rhabdoviridae, Tobaniviridae, and Togaviridae) (39, 46). For all data-collection steps below, virus names were matched to the latest accepted taxonomy according to version 2018b of the ICTV Master Species List by referring to historical taxonomic releases (47).
Following Babayan et al. (27), data on the reservoirs known to maintain the included virus species were obtained by searching common virology textbooks, such as Fields Virology (39), followed by in-depth literature searches until at least one reservoir or consistent evidence that the reservoir is currently considered as unknown was found. We summarized viral maintenance to the level of taxonomic orders of reservoirs because 1) the special reservoir hypothesis is generally articulated in terms of taxonomic order (e.g., applying to Chiroptera or Rodentia) and 2) order-level analyses constituted a reasonable compromise between taxonomic resolution and sample size, maximizing the number of virus species which could be included (27). We supplemented the single-stranded RNA virus dataset of Babayan et al. (27) with 344 additional records representing all recognized species in the families above for which reservoirs could be found. When there was evidence for independent maintenance by multiple reservoir orders, all known virus species–reservoir order combinations were recorded. For example, Rabies lyssavirus is maintained by both Carnivora and Chiroptera, but never as part of the same transmission cycle (48). Nineteen such virus species were detected, associated with 2.5 reservoir orders on average. Viruses known to be maintained by humans were retained if there was evidence for independent maintenance of a separate viral lineage in nonhuman hosts (n = 25) and otherwise discarded (n = 72). Yellow fever virus, for example, can be maintained by humans but also has an independent nonhuman primate reservoir community, and lineages from such maintenance cycles are zoonotic (39). Two virus species, Mammalian orthoreovirus and Usutu virus, had reservoir communities currently thought to span multiple taxonomic orders and were excluded from further analysis. Finally, the dataset was restricted to contain only viruses associated with mammalian and avian reservoir groups for which at least five viruses were known. The zoonotic status of individual virus species was obtained by combining records of detected human infections from Olival et al. (9) (n = 342 virus species) and Woolhouse and Brierley (29) (n = 70) with additional literature searching (n = 3). Only detections where the identity of the virus infecting humans was confirmed to species level by PCR or sequencing were considered.
Statistical Modeling.
We used logistic regression models to assess the association between reservoir group and zoonotic status (a binary response variable). Because at least one previously reported predictor of zoonotic status—publication count—was expected to be nonlinear (9), we used generalized additive mixed models (48). Three possible representations of a reservoir host effect were included (described below in more detail) and combined with all possible combinations of additional variables that were previously reported to predict zoonotic status. These included measures of research effort, the phylogenetic distance between each reservoir taxonomic order and primates, the species richness of each reservoir order, whether or not the virus was transmitted by arthropods or replicated exclusively in the cytoplasm, and a hierarchical representation of virus taxonomy. Previously reported variables relating to host species, such as geographic overlap with humans, could not be included when summarizing reservoirs at the level of taxonomic order.
The simplest reservoir effect was a random intercept for each reservoir taxonomic order, with all reservoir orders assumed independent. This represented the typically assumed special reservoir effect, in which some reservoirs are more prone to maintain zoonotic viruses than others. A second representation allowed clustering on the reservoir phylogeny to represent the hypothesis that related reservoir groups have correlated associations with zoonotic viruses. For example, mammalian reservoirs may be associated with a larger fraction of zoonoses than avian reservoirs, or related mammalian clades may share phylogenetically conserved features which shape their association with zoonoses. This phylogenetic random effect was implemented as a multivariate normal distribution, where phylogenetic relationships among taxa determined the amount of correlation between randomly sampled intercepts for different reservoir taxonomic orders (51). The variance–covariance matrix of this distribution took the form σ2Aσ2A, where σ2σ2 is a variance parameter to be estimated and A is a known variance–covariance matrix derived from a phylogeny (51, 52). We used a composite time-scaled reservoir phylogeny representing the mean divergence dates for all clades estimated across multiple studies, as contained in the TimeTree database (51). Following Longdon et al. (36), this phylogeny was converted to a variance–covariance matrix by assuming a Brownian motion model of trait evolution, using the vcv.phylo function in the APE package in R version 3.5.1 (52, 53). The third representation of a reservoir effect allowed independent random intercepts for each combination of reservoir order and virus family (i.e., the random effect of reservoir order was nested within virus family). This represented the hypothesis that specific reservoirs influence the propensity for viruses to be zoonotic for only some virus families, or that the identity of special reservoirs differs between families.
We used two measures to correct for the effects of variation in research effort on observations of zoonotic transmission: the numbers of results matching PubMed Central queries related to 1) virus species and 2) reservoir group (on 1 November 2019). For each virus species, this query was “<taxid>[Organism:noexp],” where “<taxid>” was replaced by the NCBI Taxonomy ID corresponding to each virus species. Viruses with no entry in the NCBI taxonomy database were removed from all analyses (this affected Cercopithecine gammaherpesvirus 14 and Hare fibroma virus, neither of which have publicly available sequence data in GenBank, meaning their reported reservoir associations are questionable). To capture a measure of the virus-related research effort in each reservoir group, a set of queries of the form “<taxid>[Organism:noexp] AND virus” were constructed, replacing “<taxid>” with the NCBI Taxonomy ID of each taxonomic order in turn. For nonhuman primates, this query was modified to “(txid9443[Organism:noexp] NOT txid9606[Organism:noexp]) AND virus,” where “txid9443” is the Taxonomy ID for the order Primates, and “txid9606” is the Taxonomy ID specific to Homo sapiens. Both variables were included as the natural logarithm of the respective publication counts, reflecting our prior belief that the effect of increasing numbers of publications would become saturated at high values. Nevertheless, we also allowed for additional nonlinear effects by fitting both variables as thin-plate smooths with 10 and 8 knots for virus and reservoir publication counts, respectively (54).
Phylogenetic distance was calculated as the cophenetic distance between each reservoir order and primates, using the same time-scaled reservoir phylogeny as above. Following Olival et al. (9), this effect was log(x + 1)-transformed in all models. The species richness represented by each reservoir order was derived from the Catalogue of Life using version 0.9.6 of the taxize library in R (55, 56). Both variables were fit as a thin-plate smooths with 6 and 10 knots, respectively.
The taxonomic random effect of virus family used the same specification as the reservoir phylogenetic effect above. Because the included virus families were too diverse to be represented in a single phylogeny (and might not share a common ancestor), a variance–covariance matrix representing currently accepted virus taxonomic relationships was generated. This matrix reflects the proportion of the taxonomy that is shared between virus families. Specifically, pairs of viruses were assigned a similarity score N/max(N), where N is the number of taxonomic levels they share, and max(N) the total number of taxonomic levels. This calculation was performed considering all taxonomic levels from realm to family. Thus, viruses in the same virus family received a similarity value of 1, while viruses from different families in the same order (e.g., Bunyavirales) received a value of 0.8. Virus species sharing no taxonomic levels were treated as independent (similarity = 0). Missing taxonomic assignments were interpolated to retain a comparable number of levels across all viruses, ensuring that all viruses remained independent at all levels not supported by the official ICTV taxonomy. For example, since many viruses are not classified using suborders a gap between order and family was bridged by creating a new level, assigning each family to its own unique suborder. This approach generated several free-floating branches, which are assumed independent in our models, but this is consistent with current virus taxonomy (ICTV Master Species List 2018b, https://ictv.global/files/master-species-lists/; SI Appendix, Fig. S3).
All models were fit using restricted maximum likelihood in the mgcv library in R and subsequently ranked by AIC (57, 58). The validity of models was checked using both standard methods implemented in the mgcv library and by inspecting simulated residuals generated using the DHARMa library in R (59). To calculate the proportion of the deviance explained by each term, each model was compared to submodels fit in the absence of individual terms, fixing the values for the smoothing parameters of the remaining terms to those estimated in the full model. The proportion of the deviance explained was calculated as (Di−DF)/D0(Di−DF)/D0, where DiDi is the deviance of model i, DFDF is the deviance of the full model, and D0D0 is the deviance of an intercept-only model.
To investigate potential explanations for differences in either the number of virus species or the number of zoonotic species associated with each reservoir order, two independent sets of negative binomial generalized linear models (GLMs) were fit to the counts of each virus type using the MASS library in R (60). Both sets of models contained all possible combinations of variables describing the log number virus-related publications associated with each reservoir, log phylogenetic distance to primates, log species richness in each reservoir, and a binary variable describing whether the reservoir is mammalian. We considered simpler Poisson GLMs instead of the negative binomial GLMs, but these showed strong overdispersion in simulated residuals using the DHARMa library.
Diversity Calculations.
The distribution of viral diversity among reservoir groups was quantified by calculating profiles of normalized alpha diversity using the rdiversity library in R (30). These calculations incorporated a species-level taxonomic similarity matrix, reflecting the proportion of the taxonomy that is shared between virus species and calculated as described for the family-level similarity matrix above.
We thank Dan Haydon and Roman Biek for helpful comments on earlier versions of this manuscript, as well as two anonymous reviewers, whose suggestions greatly improved the clarity of this publication. D.G.S. was supported by a Sir Henry Dale Fellowship, jointly funded by the Wellcome Trust and Royal Society (102507/Z/13/Z) and a Wellcome Senior Research Fellowship (217221/Z/19/Z). Additional funding was provided by the Medical Research Council through programme grants MC_UU_12014/8 and MC_UU_12014/12. Reservoir silhouettes were obtained from phylopic.org and were created by Matt Martyniuk (Anseriformes), Brian Gratwicke and T. Michael Keesey (Carnivora), and Sarah Werning (Lagomorpha), used with permission (https://creativecommons.org/licenses/by/3.0). Additional silhouettes by Andrew Butko (Passeriformes; https://creativecommons.org/licenses/by-sa/3.0) and Tamara L. Clark (Perissodactyla; https://creativecommons.org/licenses/by-nc-sa/3.0). All other silhouettes are in the public domain.
, Diseases of humans and their domestic mammals: Pathogen characteristics, host range and the risk of emergence. Philos. Trans. R. Soc. Lond. B Biol. Sci. 356, 991–999 (2001).OpenUrlCrossRefPubMedGoogle Scholar
., A comparison of bats and rodents as reservoirs of zoonotic viruses: Are bats special? Proc. Biol. Sci. 280, 20122753 (2013).OpenUrlCrossRefPubMedGoogle Scholar
., Contraction of the type I IFN locus and unusual constitutive expression of IFN-α in bats. Proc. Natl. Acad. Sci. U.S.A. 113, 2696–2701 (2016).OpenUrlAbstract/FREE Full TextGoogle Scholar
., Dampened NLRP3-mediated inflammation in bats and implications for a special viral reservoir host. Nat. Microbiol. 4, 789–799 (2019).OpenUrlGoogle Scholar
, “Are bats exceptional viral reservoirs?” in New Directions in Conservation Medicine: Applied Cases of Ecological Health, A. A. Aguirre, R. Ostfeld, P. Daszak, Eds. (Oxford University Press, 2012), pp. 195–212.Google Scholar
., Network analysis of host-virus communities in bats and rodents reveals determinants of cross-species transmission. Ecol. Lett. 18, 1153–1162 (2015).OpenUrlCrossRefGoogle Scholar
U. Karakus et al
., MHC class II proteins mediate cross-species entry of bat influenza viruses. Nature 567, 109–112 (2019).OpenUrlCrossRefGoogle Scholar
, Phylogenetically related and ecologically similar carnivores harbour similar parasite assemblages. J. Anim. Ecol. 83, 671–680 (2014).OpenUrlGoogle Scholar
, Ability to replicate in the cytoplasm predicts zoonotic transmission of livestock viruses. J. Infect. Dis. 199, 565–568 (2009).OpenUrlCrossRefPubMedGoogle Scholar
., Experimental inoculation of Artibeus jamaicensis bats with dengue virus serotypes 1 or 4 showed no evidence of sustained replication. Am. J. Trop. Med. Hyg. 91, 1227–1234 (2014).OpenUrlAbstract/FREE Full TextGoogle Scholar
., Neotropical bats that co-habit with humans function as dead-end hosts for dengue virus. PLoS Negl. Trop. Dis. 11, e0005537 (2017).OpenUrlGoogle Scholar
., Virus taxonomy: The database of the international committee on taxonomy of viruses (ICTV). Nucleic Acids Res. 46, D708–D717 (2018).OpenUrlCrossRefGoogle Scholar
, Fast stable restricted maximum likelihood and marginal likelihood estimation of semiparametric generalized linear models. J. R. Stat. Soc. B 73, 3–36 (2011).OpenUrlCrossRefPubMedGoogle Scholar
, General quantitative genetic methods for comparative biology: Phylogenies, taxonomies and multi-trait models for continuous and categorical characters. J. Evol. Biol. 23, 494–508 (2010).OpenUrlCrossRefPubMedGoogle Scholar
, Fast stable direct fitting and smoothness selection for generalized additive models. J. R. Stat. Soc. Series B Stat. Methodol. 70, 495–518 (2008).OpenUrlGoogle Scholar
I am writing in response to the unprecedented situation now presented by COVID-19 in North America. Early suggestions regarding potential transmission of SARS-CoV2 from humans to bats have raised serious concerns among research colleagues, rehabilitators, and cavers. In perusing available knowledge, I agree with veterinarian, Renee Schott. She has pointed out that we can’t control the public and their interactions with bats. Also, she notes that “COVID is everywhere in the U.S. right now. If North American bats can get it, they will get it.” She further warns that inappropriate restrictions could hasten the spread.
I sympathize with federal and state agencies who will be expected to take protective actions. Nevertheless, premature action could prove worse than none at all. SARS-CoV2 is already present worldwide, and bats appear highly resistant to coronaviruses. We seem to be considering rather serious actions to ward off threats not yet proven to exist and that may have serious unintended consequences.
Researchers unable to rapidly comply with new restrictions are already facing costly disruptions and termination of projects essential to conservation. Rehabilitators, forbidden to further assist bats, are reporting high-risk public actions. How would caving restrictions be enforced in state and federally managed tour caves, for example at Mammoth Cave or Carlsbad? And how could long-term restrictions on public access to other caves be enforced? What are the potential consequences of frightening the public with hypothesized disease transmission from mere breathing?
When faced with the choice of protecting bat benefits versus one’s family from potential death, the outcome is clear. Public overreaction to hypothetical threats of disease from bat droppings, or even bat breath, could prove disastrous, leading to intolerance and widespread killing of bats. Media speculation has already caused harm that may last for decades.
Regardless of presence in bats, new COVID strains in humans and other animals likely will appear. State and federal agencies, who have a responsibility to protect wildlife, cannot stop all interactions with wildlife, and bats are far from the only animals that can contract COVID. It’s already in cats and dogs.
As veterinarian, John Huckabee, has suggested for bat rehabilitators, the watchful eyes of researchers and cavers could prove invaluable, both in protecting bats from fearful humans and in providing early surveillance. We can only hope that government decision makers will consider the Hippocratic oath—first do no harm.
For further information on the COVID-19 pandemic and how it relates to bats, please read my editorial “A Viral Witch Hunt” published in the March 27 edition of Issues in Science and Technology.


