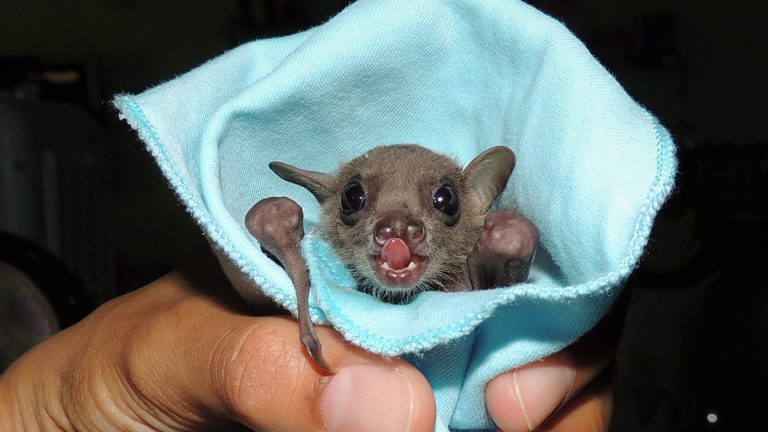
A study by UC Davis testing over 400 species of animals for susceptibility to SARS-CoV-2 infection has found that all of the various species of bats involved were either at low or very low risk for infection. The Chinese rufous horseshoe bat (Rhinolophus sinicus), from which a coronavirus very similar to SARS-CoV-2 was identified, was included in this study and also found to be a poor receptor for Covid! This means that bats are not easily infected with Covid and therefore are not spreading it.
Publication starts below:

Broad host range of SARS-CoV-2 predicted by comparative and structural analysis of ACE2 in vertebrates

 View ORCID ProfileJoana Damas,  View ORCID ProfileGraham M. Hughes,  View ORCID ProfileKathleen C. Keough,  View ORCID ProfileCorrie A. Painter,  View ORCID ProfileNicole S. Persky,  View ORCID ProfileMarco Corbo,  View ORCID ProfileMichael Hiller,  View ORCID ProfileKlaus-Peter Koepfli,  View ORCID ProfileAndreas R. Pfenning,  View ORCID ProfileHuabin Zhao,  View ORCID ProfileDiane P. Genereux,  View ORCID ProfileRoss Swofford,  View ORCID ProfileKatherine S. Pollard,  View ORCID ProfileOliver A. Ryder,  View ORCID ProfileMartin T. Nweeia,  View ORCID ProfileKerstin Lindblad-Toh,  View ORCID ProfileEmma C. Teeling,  View ORCID ProfileElinor K. Karlsson, and  View ORCID ProfileHarris A. LewinPNAS first published August 21, 2020 https://doi.org/10.1073/pnas.2010146117

  1. Edited by Scott V. Edwards, Harvard University, Cambridge, MA, and approved July 31, 2020 (received for review June 2, 2020)

Significance

The novel severe acute respiratory syndrome coronavirus 2 (SARS-CoV-2) is the cause of COVID-19, a major pandemic that threatens millions of human lives and the global economy. We identified a large number of mammals that can potentially be infected by SARS-CoV-2 via their ACE2 proteins. This can assist the identification of intermediate hosts for SARS-CoV-2 and hence reduce the opportunity for a future outbreak of COVID-19. Among the species we found with the highest risk for SARS-CoV-2 infection are wildlife and endangered species. These species represent an opportunity for spillover of SARS-CoV-2 from humans to other susceptible animals. Given the limited infectivity data for the species studied, we urge caution not to overinterpret the predictions of the present study.

Abstract

The novel coronavirus severe acute respiratory syndrome coronavirus 2 (SARS-CoV-2) is the cause of COVID-19. The main receptor of SARS-CoV-2, angiotensin I converting enzyme 2 (ACE2), is now undergoing extensive scrutiny to understand the routes of transmission and sensitivity in different species. Here, we utilized a unique dataset of ACE2 sequences from 410 vertebrate species, including 252 mammals, to study the conservation of ACE2 and its potential to be used as a receptor by SARS-CoV-2. We designed a five-category binding score based on the conservation properties of 25 amino acids important for the binding between ACE2 and the SARS-CoV-2 spike protein. Only mammals fell into the medium to very high categories and only catarrhine primates into the very high category, suggesting that they are at high risk for SARS-CoV-2 infection. We employed a protein structural analysis to qualitatively assess whether amino acid changes at variable residues would be likely to disrupt ACE2/SARS-CoV-2 spike protein binding and found the number of predicted unfavorable changes significantly correlated with the binding score. Extending this analysis to human population data, we found only rare (frequency <0.001) variants in 10/25 binding sites. In addition, we found significant signals of selection and accelerated evolution in the ACE2 coding sequence across all mammals, and specific to the bat lineage. Our results, if confirmed by additional experimental data, may lead to the identification of intermediate host species for SARS-CoV-2, guide the selection of animal models of COVID-19, and assist the conservation of animals both in native habitats and in human care.

Severe acute respiratory syndrome coronavirus 2 (SARS-CoV-2) is the cause of COVID-19, a major pandemic that threatens millions of lives and the global economy (1). Comparative analysis of SARS-CoV-2 and related coronavirus sequences has shown that SARS-CoV and SARS-CoV-2 likely had ancestors that originated in bats, followed by transmission to an intermediate host, and that both viruses may have an extended host range that includes primates and other mammals (13). Many mammalian species host coronaviruses and these infections are frequently associated with severe clinical diseases, such as respiratory and enteric disease in pigs and cattle (45). Molecular phylogenetics revealed that at least one human coronavirus (HCov-OC43) may have originated in cattle or swine and that this virus was associated with a human pandemic that emerged in the late 19th century (6). Recent data indicate that coronaviruses can be transmitted from bats to other wildlife species and humans (7), and from humans to tigers (8) and pigs (9). Therefore, understanding the host range of SARS-CoV-2 and related coronaviruses is essential for improving our ability to predict and control future pandemics. It is also crucial for protecting populations of wildlife species in native habitats and under human care, particularly nonhuman primates, which may be susceptible to COVID-19 (10).

The angiotensin I converting enzyme 2 (ACE2) serves as a functional receptor for the spike protein (S) of SARS-CoV and SARS-CoV-2 (1112). Under normal physiological conditions, ACE2 is a dipeptidyl carboxypeptidase that catalyzes the conversion of angiotensin I into angiotensin 1-9, a peptide of unknown function (13). ACE2 also converts angiotensin II, a vasoconstrictor, into angiotensin 1-7, a vasodilator that affects the cardiovascular system (13) and may regulate other components of the renin–angiotensin system (14). The host range of SARS-CoV-2 may be extremely broad due to the conservation of ACE2 in mammals (212). While SARS-CoV-2 and related coronaviruses use human ACE2 as a primary receptor, coronaviruses may use other proteases as receptors, such as CD26 (DPP4) for Middle East Respiratory Syndrome (MERS)-CoV (15), thus limiting or extending host range.

In humans, ACE2 may be a cell membrane protein or it may be secreted (13). The secreted form is created primarily by enzymatic cleavage of surface-bound ACE2 by ADAM17 and other proteases (13). ACE2 maps to the human X chromosome. Many synonymous and nonsynonymous mutations have been identified in this gene, although most of these are rare at the population level (16), and few are believed to affect cellular susceptibility to human coronavirus infections (17). Site-directed mutagenesis and coprecipitation of SARS-CoV constructs have revealed critical residues on the ACE2 tertiary structure that are essential for binding to the virus receptor-binding domain (RBD) (18). These findings are supported by the cocrystallization and structural determination of the SARS-CoV and SARS-CoV-2 S proteins with human ACE2 (121920), as well as binding affinity with nonhuman ACE2 (18). Coronaviruses may adapt to new hosts in part through mutations in S that enhance binding affinity for ACE2. The best-studied example is the evolution of SARS-CoV-like coronaviruses in the masked palm civet, which is believed to be the intermediate host for transmission of a SARS-CoV-like virus from bats to humans (2). The masked palm civet SARS-CoV S acquired two mutations that increased its affinity for human ACE2 (2). An intermediate host for SARS-CoV-2 has not been identified definitively, although the Malayan pangolin has been proposed (21).

Comparative analysis of ACE2 protein sequences can be used to predict their ability to bind SARS-CoV-2 S (2) and therefore may yield important insights into the biology and potential zoonotic transmission of SARS-CoV-2 infection. Recent work predicted ACE2/SARS-CoV-2 S-binding affinity in some vertebrate species, but phylogenetic sampling was extremely limited (1022). Here, we used a combination of comparative genomic approaches and protein structural analysis to assess the potential of ACE2 homologs from 410 vertebrate species (including representatives from all vertebrate classes: fishes, amphibians, birds, reptiles, and mammals) to serve as a receptor for SARS-CoV-2 and to understand the evolution of ACE2/SARS-CoV-2 S-binding sites. Our results reinforce earlier findings on the natural host range of SARS-CoV-2 and predict a broader group of species that may serve as a reservoir or intermediate host(s) for this virus. Importantly, many threatened and endangered species were found to be at potential risk for SARS-CoV-2 infection based on their ACE2 binding score, suggesting that as the pandemic spreads humans could inadvertently introduce a potentially devastating new threat to these already vulnerable populations, especially the great apes and other primates.

Results

Comparison of Vertebrate ACE2 Sequences and Their Predicted Ability to Bind SARS-CoV-2.

We identified 410 unique vertebrate species with ACE2 orthologs (Dataset S1), including representatives of all vertebrate taxonomic classes. Among these were 252 mammals, 72 birds, 65 fishes, 17 reptiles, and 4 amphibians. Twenty-five amino acids corresponding to known SARS-CoV-2 S-binding residues (101220) were examined for their similarity to the residues in human ACE2 (Figs. 1 and 2 and Dataset S1). On the basis of known interactions between specific residues on ACE2 and the RBD of SARS-CoV-2 S, a set of rules was developed for predicting the propensity for S binding to ACE2 from each species (Materials and Methods). Five score categories were predicted: very high, high, medium, low, and very low. Results for all species are shown in Dataset S1, and results for mammals only are shown in Figs. 1 and 2. The very high classification had at least 23/25 ACE2 residues identical to human ACE2 and other constraints at SARS-CoV-2 S-binding hot spots (Materials and Methods). The 18 species predicted as very high were all Old-World primates and great apes with ACE2 proteins identical to human ACE2 across all 25 binding residues. The ACE2 proteins of 28 species were classified as having a high propensity for binding the SARS-CoV-2 S RBD. Among them are 12 cetaceans (whales and dolphins), 7 rodents, 3 cervids (deer), 3 lemuriform primates, 2 representatives of the order Pilosa (giant anteater and southern tamandua), and 1 Old-World primate (Angola colobus; Fig. 1). Fifty-seven species scored as medium for the propensity of their ACE2 to bind SARS-CoV-2 S. This category has at least 20/25 residues identical to human ACE2 but more relaxed constraints for critical binding residues. All species with medium score are mammals distributed across six orders.

Fig. 1.

Fig. 1.

Cross-species conservation of ACE2 at the known binding residues and predictions of SARS-CoV-2 S-binding propensity. Species are sorted by binding scores. The ID column depicts the number of amino acids identical to human binding residues. Bold amino acid positions (also labeled with asterisks) represent residues at binding hot spots and constrained in the scoring scheme. Each amino acid substitution is colored according to its classification as nonconservative (orange), semiconservative (yellow), or conservative (blue), as compared to the human residue. Bold species names depict species with threatened IUCN risk status. The 410 vertebrate species dataset is available in Dataset S1.

Fig. 2.

Fig. 2.

Cross-species conservation of ACE2 at the known binding residues and predictions of SARS-CoV-2 S-binding propensity. Species are sorted by binding scores. The ID column depicts the number of amino acids identical to human binding residues. Bold amino acid positions (also labeled with asterisks) represent residues at binding hot spots and constrained in the scoring scheme. Each amino acid substitution is colored according to its classification as nonconservative (orange), semiconservative (yellow), or conservative (blue), as compared to the human residue. Bold species names depict species with threatened IUCN risk status. The 410 vertebrate species dataset is available in Dataset S1.

Among Carnivora, 9/43 scored medium, 9/43 scored low, and 25/43 scored very low (Figs. 1 and 2). The carnivores scoring medium were exclusively felids, including the domestic cat and Siberian tiger. Among the 13 primate species scoring medium, there were 10 New-World primates and three lemurs. Of 45 rodent species, 11 scored medium. Twenty-one of 30 artiodactyls scored medium, including several important wild and domesticated ruminants, such as domesticated cattle, bison, sheep, goat, water buffalo, Masai giraffe, and Tibetan antelope. Species scoring medium also included two of three lagomorphs and one cetacean.

All chiropterans (bats) scored low (n = 8) or very low (n = 29; Fig. 2), including the Chinese rufous horseshoe bat, from which a coronavirus (SARSr-CoV ZC45) related to SARS-CoV-2 was identified (1). Only 7.7% (3/39) primate species’ ACE2 scored low or very low, and 61% of rodent species scored low (10/46) or very low (18/46). All monotremes (n = 1) and marsupials (n = 4), birds (n = 72), fish (n = 65), amphibians (n = 4), and reptiles (n = 17) scored very low, with fewer than 18/25 ACE2 residues identical to the human and many nonconservative amino acid substitutions at the remaining nonidentical sites (Dataset S1). Notable species scoring very low include the Chinese pangolin, Sunda pangolin, and white-bellied pangolin (Fig. 2 and Dataset S1).

Structural Analysis of the ACE2/SARS-CoV-2 S-Binding Interface.

We complemented the sequence identity-based scoring scheme with a qualitative structure-based scoring system. Our approach was to take the 55 variants of individual residues observed in the ACE2 binding interface, excluding glycosylation sites, from 28 representative species, and identify the best-fit rotamer for each variant when modeled onto the human crystal structure 6MOJ (12). Each variant was then assigned to one of three groups: neutral (likely to maintain similar contacts; 18 substitutions), weaken (likely to weaken the interaction; 14 substitutions), or unfavorable (likely to introduce unfavorable interactions; 23 substitutions; SI Appendix, Fig. S1). Variations of residue S19 were excluded because of conflicting results between the two structures of the human ACE2/SARS-CoV-2 S protein complexes 6MOJ and 6VW1 at this site (the two structures were in agreement for all other residues at the binding interface). The structural binding assessments complement the sequence identity analysis, with the fraction of residues ranked as unfavorable correlating very strongly with the substitution scoring scheme (Spearman correlation rho = 0.76; P < 2.2e-16; Fig. 3). To check for easily identifiable gross conformational changes between ACE2 proteins of different species that could potentially cause misinterpretation of the ACE2/SARS-CoV-2 S interface, we also generated homology models of ACE2 from the 28 representative species and compared them to the human structures. All models showed high similarity to the human protein along the C⍺ backbone (SI Appendix, Fig. S2) with an rmsd range of 0.06 to 0.17. Among all 28 structures, high coverage ranging from 91 to 99% and high global model quality estimation ranging between 0.82 and 0.89 (SI Appendix, Table S1), as assessed in CHIMERA, indicated a lack of major conformational changes between species and supported the validity of using human structures as a template for modeling variants of ACE2 interface residues across species.

Fig. 3.

Fig. 3.

Congruence between binding score and the structural homology analysis. Species predicted with very high (red) or high binding scores (orange) have significantly fewer amino acid substitutions rated as potentially altering the binding interface between ACE2 and SARS-CoV-2 using protein structural analysis when compared to species with low (green) or very low (blue) binding scores. The more severe unfavorable variants are counted on the y axis and less severe weaken variants on the x axis. Black numerical labels indicate species count.

Structural Analysis of Variation in Human ACE2.

We examined the variation in ACE2 binding residues within humans, some of which have been proposed to alter binding affinity (172326). We integrated data from six different sources, dbSNP, 1KGP, Topmed, UK10K, gnomAD, and CHINAMAP, and identified a total of 11 variants in 10 of the 25 ACE2 binding residues (Dataset S2). All variants found are rare, with allele frequency (f) < 0.01 in any individual population and f < 0.0007 across all populations. Three of the 11 single-nucleotide variants were silent, leading to synonymous amino acid changes, seven were missense variants resulting in conservative amino acid substitutions, and one, S19P, resulted in a semiconservative substitution. S19P has the highest allele frequency of the 11 variants, with f = 0.0003 across all populations (16). We evaluated, by structural homology, six missense variants. Four were neutral and two weakening (E35K, f = 0.000016; E35D, f = 0.000279799). S19P was not included in our structural homology assessment, but a recent study predicted it would increase ACE2/SARS-CoV-2 binding affinity (27). Thus, with an estimated summed frequency of 0.001 (maximum of 0.004 in any single population), genetic variation in the human ACE2/SARS-CoV-2 S-binding interface is rare overall, and it is unclear whether the existing variation increases or decreases susceptibility to infection.

Evolution of ACE2 across Mammals.

We next investigated the evolution of ACE2 variation in vertebrates, including how patterns of positive selection compare between bats, a mammalian lineage that harbors a high diversity of coronaviruses (28), and other mammalian clades. We first inferred the phylogeny of ACE2 using our 410-vertebrate alignment and IQTREE, using the best-fit model of sequence evolution (JTT+F + R7) and rooting the topology on fishes (Dataset S3 and SI Appendix, Fig. S3). We then assayed sequence conservation with phyloP. The majority of ACE2 codons are significantly conserved across vertebrates and across mammals (Dataset S4.1), likely reflecting its critical function in the renin–angiotensin system (29). Ten residues in the ACE2 binding domain are exceptionally conserved in Chiroptera and/or Rodentia (Dataset S4.2).

We next used phyloP and CodeML to test for accelerated sequence evolution and positive selection, respectively. PhyloP compares the rate of evolution at each codon to the expected rate in a model estimated from third nucleotide positions of the codon and is agnostic to synonymous versus nonsynonymous substitutions (dN/dS). CodeML uses ⍵ = dN/dS > 1 and Bayes empirical Bayes (BEB) scores to identify codons under positive selection and was run on a subset of 64 representative mammals (Materials and Methods). In this way, PhyloP identifies residues evolving at a rate higher than the estimated neutral rate of evolution. In addition, CodeML identifies residues exhibiting an excess of nonsynonymous over synonymous substitutions.

ACE2 shows significant evidence of positive selection across mammals (⍵ = 1.83, likelihood ratio test [LRT] = 194.13, P < 0.001; Datasets S4.3 and S4.4). Almost 10% of codons (n = 73; 9 near the binding interface) are accelerated within mammals (Datasets S4.1 and S4.5), and 18 of these have BEB scores greater than 0.95, indicating positively selected residues (Datasets S4.5 and S4.6 and SI Appendix, Fig. S4). Nineteen accelerated residues, including two positively selected codons (Q24 and H34), are known to interact with SARS-CoV-2 S (Fig. 4 A and BDataset S4.5, and SI Appendix, Fig. S5). Q24 has not been observed to be polymorphic within the human population, and H34 harbors a synonymous polymorphism (f = 0.00063) but no nonsynonymous polymorphisms (Dataset S2).

Fig. 4.

Fig. 4.

Residues at the binding interface between ACE2 and SARS-CoV-2 S are under positive selection (CodeML analysis). In the SARS-CoV-2 spike protein RBD (light teal), this includes three positively selected residues (green, labeled with two asterisks). In ACE2 (wheat-colored, with binding interface residues in yellow), selected residues occur both outside the binding interface (dark blue) and inside the binding interface (red, labeled with one asterisk). (A) Positively selected residues in all mammals, including two at the binding interface. (BA with 90° rotation. (C) Positively selected residues in the Chiroptera lineage, including five at the binding interface. (DC with 90° rotation.

This pattern of acceleration and positive selection in ACE2 also holds for individual mammalian lineages. Using CodeML, positive selection was detected within the orders Chiroptera (LRT = 346.40, ⍵ = 3.44, P < 0.001), Cetartiodactyla (LRT = 92.86, ⍵ = 3.83, P < 0.001), Carnivora (LRT = 65.66, ⍵ = 2.27, P < 0.001), Primates (LRT = 72.33, ⍵ = 3.16, P < 0.001), and Rodentia (LRT = 91.26, ⍵ = 1.77, P < 0.001). Overall, bats had more positively selected sites with significant BEB scores (29 sites in Chiroptera compared to 10, 8, 7, and 15 sites in Cetartiodactyla, Carnivora, Primates, and Rodentia, respectively). Positive selection was found at multiple ACE2/SARS-CoV-2 S-binding residues in the bat-specific alignment. Parameters inferred by CodeML were consistent across different models of evolution (Dataset S4.6). PhyloP was used to assess shifts in the evolutionary rate within mammalian lineages, for each assessing signal relative to a neutral model trained on species from the specified lineage (Datasets S4.7–S4.12 and SI Appendix, Fig. S6). We discovered six binding residues that are accelerated in one or more of Chiroptera, Rodentia, or Carnivora, five of which also showed evidence for positive selection; G354 was accelerated in all of these lineages (Dataset S4.13).

Given pervasive signatures of adaptive evolution in ACE2 across mammals, we next sought to test if ACE2 in any mammalian lineages is evolving particularly rapidly compared to the others. CodeML branch-site tests identified positive selection in both the ancestral Chiroptera branch (one amino acid, ⍵ = 26.7, LRT = 4.22, P = 0.039) and ancestral Cetartiodactyla branch (two amino acids, ⍵ = 10.38, LRT = 7.89, P = 0.004; Dataset S4.3) using 64 mammals. These residues did not correspond to known viral binding sites. We found no evidence for lineage-specific positive selection in the ancestral primate, rodent, or carnivore lineages. PhyloP identified lineage-specific acceleration in Chiroptera, Carnivora, Rodentia, Artiodactyla, and Cetacea relative to mammals (Datasets S4.14–S4.18 and SI Appendix, Fig. S7). The power to detect acceleration within a clade scaled with the branch length of the subtree, with rodents having the highest and bats the second-highest amount of power (SI Appendix, Fig. S8 and Table S2). Bats have a particularly high level of accelerated evolution (18 codons; P < 0.05). Of these accelerated residues, T27 and M82 are binding residues for SARS-CoV-2 S, with some bat subgroups having amino acid substitutions predicted to lead to less favorable binding of SARS-CoV-2 (Fig. 4 C and D and SI Appendix, Fig. S1). Surprisingly, a residue that is conserved overall in our 410 species alignment and in the mammalian subset, Q728, is perfectly conserved in all 37 species of bats except for Old-World fruit bat species (Pteropodidae; n = 8), which have a substitution from Q to E. These results support the theory that ACE2 is under lineage-specific selective pressures in bats relative to other mammals.

Positive Selection in SARS-CoV-2 S Protein.

Positive selection was found across 43 viral strains (Dataset S4.19) at sites L455, V483, and S494 in the SARS-CoV-2 S sequence using CodeML (⍵ = 2.78, LRT = 93.72, P < 0.001). All of these sites lie within or near the ACE2/SARS-CoV-2 S RBD binding sites (Fig. 4).

Discussion

Phylogenetic analysis of coronaviruses has demonstrated that the immediate ancestor of SARS-CoV-2 most likely originated in a bat species (1). However, whether SARS-CoV-2 or the progenitor of this virus was transmitted directly to humans or through an intermediate host is not yet resolved. To identify candidate intermediate host species and species at risk for SARS-CoV-2 infection, we undertook a deep comparative genomic, evolutionary, and structural analysis of ACE2, which serves as the SARS-CoV-2 receptor in humans. We drew on the rapidly growing database of annotated vertebrate genomes, including new genomes produced by the Genomes 10K-affiliated Bat1K Consortium, Zoonomia, and Vertebrate Genomes Project, and other sources (3031). We conducted a phylogenetic analysis of ACE2 orthologs from 410 vertebrate species and predicted their propensity to bind the SARS-CoV-2 S using a score based on amino acid substitutions at 25 consensus human ACE2 binding residues (1220). Similarity-based methods are frequently used for predicting cross-species transmission of viruses (3233), including SARS-CoV (2). We supported these predictions with comprehensive structural analysis of the ACE2 binding site complexed with SARS-CoV-2 S. We also tested the hypothesis that the ACE2 receptor is under selective constraints in mammalian lineages with different susceptibilities to coronaviruses.

We predict that species scoring as very high and high for propensity of SARS-CoV-2 S binding to ACE2 will have a high probability of becoming infected by the virus and thus may be potential intermediate hosts for virus transmission. We also predict that many species having a medium score have some risk of infection, and species scored as very low and low are less likely to be infected by SARS-CoV-2 via the ACE2 receptor. Importantly, our predictions are based solely on in silico analyses and must be confirmed by direct experimental data. The prediction accuracy of the model may be improved in the future as more extensive data are generated showing the impact of ACE2 mutations on its binding affinity for SARS-CoV-2 S, which may enable knowledge-based weighting of residues in the scoring algorithm. Until the present model’s accuracy can be confirmed with additional experimental data, we urge caution not to overinterpret the predictions of the present study. This is especially important with regards to species, endangered or otherwise, in human care. While species ranked high or medium may be susceptible to infection based on the features of their ACE2 residues, pathological outcomes may be very different among species depending on other mechanisms, such as immune response, that could affect virus replication and spread to target cells, tissues, and organs. Furthermore, we cannot exclude the possibility that infection in any species occurs via another cellular receptor (for a review see ref. 34), as shown for other betacoronaviruses (35), or lower-affinity interactions with ACE2 as proposed for SARS-CoV (2). Nonetheless, our predictions provide a useful starting point for the selection of appropriate animal models for COVID-19 research and identification of species that may be at risk for human-to-animal or animal-to-animal transmissions of SARS-CoV-2.

Several recent studies examined the role of ACE2 in SARS-CoV-2 binding and cellular infection and its relationship to experimental and natural infections in different species (263540). Our study design differs substantially from those in several aspects: 1) we analyzed a larger number of primates, carnivores, rodents, cetartiodactyls, and other mammalian orders and an extensive phylogenetic sampling of fishes, birds, amphibians, and reptiles; 2) we analyzed the full set of S-binding residues across the ACE2 binding site, which was based on a consensus set from two independent studies (1220); 3) we used different methodologies to assess ACE2 binding capacity for SARS-CoV-2 S; and 4) our study tested for selection and accelerated evolution across the entire ACE2 protein. While our results are consistent with the results and conclusions of Melin et al. (38) on the predicted susceptibility of primates to SARS-CoV-2, particularly Old-World primates, we made predictions for a larger number of primates (n = 39 vs. n = 27), bats (n = 37 vs. n = 7), other mammals (n = 176 vs. n = 5), and other vertebrates (n = 158 vs. n = 0). When ACE2 from species in our study were compared with results of other studies there were many consistencies, such as the low risk for rodents, but some predictions differ, such as the relatively high risk predicted by others for SARS-CoV-2 S binding in pangolin and horse (39), civet (40), Chinese rufous horseshoe bat (40), and turtles (22). Our results are generally consistent with a study that tested binding affinity of soluble ACE2 for the SARS-CoV-2 S RBD using saturation mutagenesis (27), particularly in the binding hot-spot region of ACE2 residues 353 to 357 (SI Appendix, Fig. S1). Importantly, as compared with other studies, our results greatly expanded the number of candidate intermediate hosts and identified many additional threatened species that could be at risk for SARS-CoV-2 infection via their ACE2 receptors.

Evolution of ACE2.

Variation in ACE2 in the human population is rare (16). Overall, ACE2 is intolerant of loss-of-function mutations [pLI = 0.998; LOEUF = 0.25 in gnomAD v2.1.1 (16)]. We examined a large set of ACE2 variants for their potential differences in binding to SARS-CoV-2 S and their relationship to selected and accelerated sites. We found rare coding variants that would result in missense mutations causing substitutions in 7/25 binding residues (Dataset S2). Some of those [e.g., E35K, f = 0.00001636 (16)] could reduce the virus binding affinity as per our structural analysis (Dataset S2) but would potentially lower the susceptibility to the virus only in a very small fraction of the population. Our analysis suggests that some variants (e.g., D38E) might not affect binding propensity while the potential impact of others (e.g., S19P) could not be determined. Further investigations on the effects of these rare variants on ACE2/SARS-CoV-2 binding affinity are needed.

When exploring patterns of codon evolution in ACE2, we found that multiple ACE2 residues important for the binding of SARS-CoV-2 S are evolving rapidly across mammals, with two (Q24 and H34) under positive selection (Fig. 4 A and B and SI Appendix, Fig. S5). Relative to other lineages analyzed, Chiroptera has a greater proportion of accelerated versus conserved codons (SI Appendix, Fig. S6), particularly in the SARS-CoV-2 S-binding region, suggesting the possibility of selective forces on these codons in Chiroptera driven by their interactions with SARS-CoV-2-like viruses (Fig. 4 C and D and Dataset S4.13). Indeed, distinct signatures of positive selection found in bat ACE2 (41) and in the SARS-CoV-2 S protein (42) support the hypothesis that bats are evolving to tolerate SARS-CoV-2-like viruses (discussed further below).

Relationship of the ACE2 Binding Score to Known Infectivity of SARS-CoV-2.

Data on susceptibility of nonhuman species to SARS-CoV-2 is still very limited (SI Appendix, Fig. S10) but mostly agree with our predictions of ACE2 binding propensity for SARS-CoV-2 S (Figs. 1 and 2 and Dataset S1). Five out of six species with demonstrated susceptibility to SARS-CoV-2 infection score very high [rhesus macaque (43) and cynomolgus macaque (44)] or medium [domestic cat (4546), tiger (8) and golden hamster (47)]. Both species susceptible to infection but asymptomatic scored low [dog (4548) and Egyptian rousette bat (49)], and the three species resistant to infection scored either low [pig (4549)] or very low [mallard and red junglefowl (4549)].

A discrepancy was observed for ferret, which had a low ACE2 binding score but is susceptible to infection (454951). Ferrets may be a special case because of their unique respiratory biology (52). Ferrets are highly susceptible to upper respiratory tract infections and serve as models of respiratory diseases. They are susceptible to many viral diseases, including influenza type A and type B, canine distemper, and SARS-CoV (53). It has been proposed that ACE2 receptor distribution does not match the tropism of SARS-CoV in ferrets, because in ferrets viruses may use LSECTin receptor(s) to enable or enhance infectivity (5254). This may also be true for SARS-CoV-2 because the virus can potentially be glycosylated at 22 N-linked sites (55). Several studies have demonstrated SARS-CoV-2 infection in ferrets through intranasal inoculation of high doses (>105 plaque-forming units) of tissue-cultured virus, followed by direct or indirect transmission to naïve ferrets (454951). However, experimental infection via direct inoculation of high concentrations of tissue-cultured virus does not necessarily indicate infectability under natural conditions, and clinical signs of infection differed among studies. These data indicate that experimentally inoculated ferrets may become infected by another mechanism, possibly via high expression levels of low-affinity ACE2 and/or their very efficient LSECTin system.

Mammals with Predicted High Risk of SARS-CoV-2 Infection.

Of the 19 catarrhine primates analyzed, 18/19 scored very high for binding of their ACE2 to SARS-CoV-2 S and one scored high (the Angola colobus); the 18 species scoring very high had 25/25 binding residues identical to human ACE2, including rhesus macaques, which are known to be infected by SARS-CoV-2 and develop COVID-19-like clinical symptoms (343). Our analysis predicts that all Old-World primates are susceptible to infection by SARS-CoV-2 via ACE2. Thus, many of the 21 primate species native to China could be a potential reservoir for SARS-CoV-2. The remaining primate species were scored as high or medium, with only the gray mouse lemur and the Philippine tarsier scoring as low.

Although inconsistent with the species phylogeny, and overall similarity to human ACE2, we found that all three species of cervid deer and 12/14 cetacean species have high scores for binding of their ACE2s to SARS-CoV-2 S. There are 18 species of cervids found in China. While coronavirus sequences have been found in white-tailed deer (56) and gammacoronaviruses have been found in beluga whales (5758) and bottlenose dolphins (59), in which they are associated with respiratory diseases, the cellular receptor used by these viruses is not known. Studies of cellular infectivity in these species would provide important data for validating the prediction model.

Other Artiodactyls.

A relatively large fraction (21/30) of artiodactyl mammals were classified with medium score for ACE2 binding to SARS-CoV-2 S. These include many species that are found in Hubei Province and around the world, such as domesticated cattle, sheep, and goats, as well as many species commonly found in zoos and wildlife parks (e.g., Masai giraffe, okapi, hippopotamus, water buffalo, scimitar-horned oryx, and dama gazelle). Although the cattle-derived MDBK cell line was shown in one study to be resistant to SARS-CoV-2 in vitro (60), our predictions suggest that ruminant artiodactyls can serve as a reservoir for SARS-CoV-2, which would have significant epidemiological implications as well as implications for food production and wildlife management (discussed below). It is noteworthy that camels and pigs, known for their ability to be infected by other coronaviruses (28), both score low in our analysis. These data are consistent with results (discussed above) indicating that pigs cannot be infected with SARS-CoV-2 either in vivo (45) or in vitro (60) but inconsistent with transfection studies using pig ACE2 receptors expressed in HeLa cells (1).

Rodents.

Among the rodents, 7/46 species score high for ACE2 binding to SARS-CoV-2 S, and the remaining 11, 10, and 18 score medium, low, or very low, respectively. House mouse scored very low, consistent with infectivity studies (160). Given that wild rodent species likely come in contact with bats as well as with other predicted high-risk species, rodents with high and medium scores cannot be excluded as possible intermediate hosts for SARS-CoV-2.

Bats and Other Species of Interest.

Chiroptera represents a clade of mammals that are of high interest in COVID-19 research because several bat species are known to harbor coronaviruses, including those most closely related to SARS-CoV-2 (1). We analyzed ACE2 from 37 bat species, of which 8 and 29 scored low and very low, respectively. These results were intriguing because the three Rhinolophus spp. tested, including the Chinese rufous horseshoe bat, are major suspects in the transmission of SARS-CoV-2, or a closely related virus, to humans (1). Bats have been shown to harbor the highest diversity of betacoronaviruses among mammals (28) and show little pathology in individuals carrying these viruses (61).

Do bat ACE2 receptors bind SARS-CoV-2 S? Zhou et al. (1) transfected human ACE2-negative HeLa cells with ACE2 from a Chinese rufous horseshoe bat and obtained a low-efficiency infection with SARS-CoV-2. A recent report indicates that SARS-CoV-2 S protein can bind vesicular stomatitis virus (VSV) pseudotypes expressing halcyon horseshoe bat (Rhinolophus alcyone) ACE2 in BHK-21 cells (60). However, cell lines derived from big brown bat (Eptesicus fuscus) (62), Lander’s horseshoe bat (Rhinolophus landeri), and Daubenton’s bat (Myotis daubentonii) could not be infected with SARS-CoV-2 (60). Relatedly, cell lines from six different species of bats could not be infected with SARS-CoV, which also uses human ACE2 as a receptor (63). These data suggest that some bat species have evolved ACE2 receptors that do not bind SARS-CoV-like viruses or bind them with very low affinity, which is supported by our results showing positive selection and accelerated evolution of ACE2 in chiropterans. Alternatively, ACE2 expression could be very low in the bat cell lines, or SARS-CoV-2-like viruses can use other receptors, such as the MERS-CoV, a betacoronavirus that uses CD26/DPP4 (15), and porcine transmissible enteritis virus, an alphacoronavirus that uses aminopeptidase N (64). Also, other molecules required for SARS-CoV infection, such as TMPRSS2, might not be sufficiently expressed or function differently in bats.

Whether an ancestor of SARS-CoV-2, such as RaTG13, utilizes bat ACE2 is an important question related to whether bat ACE2 receptors bind SARS-CoV-2 S (discussed above). RaTG13 was found in feces of the intermediate horseshoe bat (Rhinolophus affinis) (1), but to our knowledge this virus has not been shown to bind to ACE2 of R. affinis or any other bat species. In addition, RaTG13 was reported not to infect human cells expressing Rhinolophus sinicus ACE2 in a recent study (65). Relatedly, Hoffman et al. (63) were unable to infect bat kidney- and lung-derived cell lines derived from six different species with VSV pseudotypes bearing SARS-CoV S protein or pseudotypes of two bat SARS-related CoV (Bg08 and Rp3) (63). Lack of concordance between the presence of bat SARS-CoV-like coronaviruses and binding to bat ACE2 may arise because of variations in susceptibility among bat species to SARS-CoV-like coronaviruses or due to one of the mechanisms discussed above.

Carnivores.

Recent reports of a Malayan tiger and a domestic cat infected by SARS-CoV-2 suggest that the virus can be transmitted to other felids (845). Our results are consistent with these studies; 9/9 felids we analyzed scored medium for ACE2 binding of SARS-CoV-2 S. However, the masked palm civet, a member of the Viverridae family that is related to but distinct from Felidae and proposed as the intermediate host for SARS-CoV, scored as very low. While our results are inconsistent with transfection studies using civet ACE2 receptors expressed in HeLa cells (1), these experiments have limitations as discussed above, and no data are available on infectivity in civet cells or animals. While carnivores closely related to dogs (dingoes, maned wolves, and foxes) all scored low, experimental data consistently show that dogs are not readily infected or symptomatic (456066).

Pangolins.

Considerable controversy surrounds reports that pangolins can serve as an intermediate host for SARS-CoV-2, with some reports proposing that SARS-CoV-2 arose as a recombinant between bat and pangolin betacoronaviruses (2167), while another study rejected that claim (68). In our study, ACE2 of Chinese pangolin, Sunda pangolin, and white-bellied pangolin had low or very low binding score for SARS-CoV-2 S. Binding of pangolin ACE2 to SARS-CoV-2 S was predicted using molecular binding simulations (67); however, neither experimental infection nor in vitro infection with SARS-CoV-2 has been reported for pangolins. Further studies are necessary to resolve whether SARS-CoV2 S binds to pangolin ACE2.

Other Vertebrates.

Our analysis of species in 29 orders of fishes, 29 orders of birds, 3 orders of reptiles, and 2 orders of amphibians predicts that the ACE2 proteins of species within these vertebrate classes are not likely to bind SARS-CoV-2 S. Thus, vertebrate classes other than mammals are not likely to be an intermediate host or reservoir for the virus, despite predictions reported in a recent study (39), unless SARS-CoV-2 uses another receptor for infection. With diverse nonmammal vertebrates sold in the seafood and wildlife markets of Asia and elsewhere, it is important to determine if SARS-CoV-2 can be found in nonmammalian vertebrates.

Animal Models for COVID-19.

Presently, there is a tremendous need for animal models to study SARS-CoV-2 infection and pathogenesis, as the only species currently known to be infected and show similar symptoms of COVID-19 is rhesus macaque. Nonhuman primate models have proven to be highly valuable for other infectious diseases but are expensive to maintain and numbers of experimental animals are limited. Our results provide an extended list of potential animal models for SARS-CoV-2 infection and pathogenesis, including large animals maintained for biomedical and agricultural research (e.g., domesticated sheep and cattle), and Chinese hamster and Syrian/golden hamster (47), which may be preferred due to their easier handling and already established value as models for other human diseases caused by viruses (69).

Relevance to Threatened Species.

Among the 103 species that scored very high, high, and medium for ACE2/SARS-CoV-2 S binding, 41 (40%) are classified in one of three “threatened” categories (vulnerable, endangered, and critically endangered) on the International Union of Conservation of Nature (IUCN) Red List of Threatened Species, five are classified as near threatened, and two species are classified as extinct in the wild (70) (Dataset S1). This represents only a small fraction of the threatened species potentially susceptible to SARS-CoV-2. For example, all 20 catarrhine primate species in our analysis, representing three families (Cercopithecidae, Hylobatidae, and Hominidae) scored very high, suggesting that all 185 species of catarrhine primates, including 62 classified as threatened, are potentially susceptible to SARS-CoV-2. Similarly, all three species of deer, representatives of a family of ∼92 species (Cervidae), including 25 classified as threatened, scored as high. In contrast, some threatened species scored low or very low, such as the giant panda (low), potentially positive news for these at-risk populations.

In Cetacea, 12 of 14 species score as high, and of those two are threatened. Toothed whales have potential for viral outbreaks and have lost function of a gene that is key to the antiviral response in other mammalian lineages (71). If they are susceptible to SARS-CoV-2, human-to-animal transmission could pose a risk through sewage outfall (72) and contaminated refuse from cities, commercial vessels, and cruise liners (73). Our results have practical implications for populations of threatened species in the wild and those under human care (including those in zoos). Established guidelines for minimizing potential human-to-animal transmission should be implemented and strictly followed. Guidelines for field researchers working on great apes established by the IUCN have been in place since 2015 in response to previous human disease outbreaks (74) and have received renewed attention because of SARS-CoV-2 (7476). For zoos, guidelines in response to SARS-CoV-2 have been distributed by several taxon advisory groups of the North American Association of Zoos and Aquariums, the American Association of Zoo Veterinarians, and the European Association of Zoo and Wildlife Veterinarians, and these organizations are actively monitoring and updating knowledge of species in human care considered to be potentially sensitive to infection (7778). Although in silico studies suggest potential susceptibility of diverse species, verification of infection potential is warranted, using cell cultures, stem cells, organoids, and other methods that do not require direct animal infection studies. Zoos and other facilities that maintain living animal collections are in a position to provide such samples for generating crucial research resources by banking tissues and cryobanking viable cell cultures in support of these efforts.

Materials and Methods

ACE2 Coding and Protein Sequences.

All human ACE2 orthologs for vertebrate species, and their respective coding sequences, were retrieved from NCBI Protein (20 March 2020) (79). ACE2 coding DNA sequences were extracted from available or recently sequenced genome assemblies for 123 other mammalian species, with the help of genome alignments and the human or within-family ACE2 orthologs. The protein sequences were predicted using AUGUSTUS v3.3.2 (80) or CESAR v2.0 (81) and the translated protein sequences were checked against the human ACE2 ortholog. ACE2 gene predictions were inspected and manually curated if necessary. For four bat species (Micronycteris hirsutaMormoops blainvilleiTadarida brasiliensis, and Pteronotus parnellii) the ACE2 coding region was split into two scaffolds which were merged, and for Eonycteris spelaea a putative 1-bp frameshift base error was corrected. Eighty ACE2 protein sequence predictions were obtained from the Zoonomia project, 19 from the Hiller Lab, 12 from the Koepfli laboratory, 8 from the Lewin laboratory, and 4 from the Zhao laboratory. The sources and accession numbers for the genomes or proteins retrieved from NCBI are listed in Dataset S1. The final set of ACE2 coding and protein sequences originated from 410 vertebrate species. To ensure alignment robustness, the full set of coding and protein sequences were aligned independently using Clustal Omega (82), MUSCLE (83), and COBALT (84), all with default parameters. All resulting protein alignments were identical. Clustal Omega alignments were used in the subsequent analysis. The classification of amino acid substitutions as conservative, semiconservative, and nonconservative were based on Clustal Omega definitions, which rely on the Gonnet Pam250 matrix scores. Briefly, a conservative substitution indicates a change to an amino acid with strongly similar biochemical/physicochemical properties, a semiconservative substitution depicts a change to an amino acid with weakly similar properties, and a nonconservative substitution depicts a change to an amino acid with no biochemical/physicochemical similarities.

Identification of ACE2 Residues Involved in Binding to SARS-CoV-2 S Protein.

We identified 22 ACE2 protein residues that were previously reported to be critical for the effective binding of ACE2 RBD and SARS-CoV-2 S (1220). These residues include S19, Q24, T27, F28, D30, K31, H34, E35, E37, D38, Y41, Q42, L45, L79, M82, Y83, N330, K353, G354, D355, R357, and R393. All these residues were identified from the cocrystallization and structural determination of SARS-CoV-2 S and ACE2 RBD (1220). The known human ACE2 RBD glycosylation sites N53, N90, and N322 were also included in the analyzed residue set (10).

ACE2 and SARS-CoV-2 Binding Ability Prediction.

Based on the known interactions of ACE2 and SARS-CoV-2 residues, we developed a set of rules for predicting the likelihood of the SARS-CoV-2 S binding to ACE2. These rules are primarily based on sequence similarity to the human ACE2 binding residues, with targeted rules applied to positions K353, K31, E35, M82, N53, N90, and N322 based on the effects of amino acid substitution on binding of SARS-CoV S (19). Sites N53, N90, and N322 are glycosylation sites at which disruption has been shown to affect viral attachment (1019). K353 and K31 are virus-binding hot spots; K353 establishes a salt bridge with ACE2 D38, and K31 forms a hydrogen bond with SARS-CoV-2 Q493 (1220). E35 supports the K31 binding hot spot by also establishing a hydrogen bond with SARS-CoV-2 Q493. The disruption of interactions at these residues, as well as the replacement of M82, were shown to significantly affect the attachment of SARS-CoV (19). Each species was classified in one of five categories: very high, high, medium, low, or very low potential for ACE2 binding to SARS-CoV-2 S. Species in the very high category have at least 23/25 critical residues identical to the human; have K353, K31, E35, M82, N53, N90, and N322; and have only conservative amino acid substitutions among the nonidentical 2/25 residues. Species in the high group have at least 20/25 residues identical to the human; have K353; have only conservative substitutions at K31 and E35; and can only have one nonconservative amino acid substitution among the 5/25 nonidentical residues. Species scoring medium have at least 20/25 residues identical to the human; can only have conservative substitutions at K353, K31, and E35; and can have up to two nonconservative amino acid substitutions in the 5/25 nonidentical residues. Species in the low category have at least 18/25 residues identical to the human; can only have conservative substitutions at K353; and can have up to three nonconservative amino acid substitutions on the remaining 7/25 nonidentical residues. Finally, species in the very low group have fewer than 18/25 residues identical to the human or have at least four nonconservative amino acid substitutions in the nonidentical residues.

Protein Structure Analysis.

For 28 representative species, we modeled each exhibited individual variant onto the human structure 6MOJ (12), in the program CHIMERA (85), by choosing the rotamer with the least number of clashes, retaining the most initial hydrogen bonds, and containing the highest probability of formation as calculated by the CHIMERA program from the Dunbrack 2010 backbone-dependent rotamer library (SI Appendix, Fig. S9) (86). The chosen rotamer of the variant amino acid was then evaluated in the context of its structural environment and assigned a score based on the likelihood of interface disruption. “Neutral” was assigned if the residue maintained a similar environment as the original residue and was predicted to maintain or in some cases increase affinity. “Weakened” was assigned if hydrophobic contacts were lost and contacts that appear disruptive are introduced that are not technically clashes. “Unfavorable” was assigned if clashes are introduced and/or a hydrogen bond is broken. Potential for gross conformational changes between ACE2 proteins was checked by individually extracting a representative subset of the 28 species’ ACE2 proteins from the multiway alignment, which was then individually loaded into SWISS-Model (87) to generate homology-derived models. The output files were aligned to the template structure 6M18 (88), which is a cryo-electron microscopy model of the SARS-CoV-2 model. Because the amino acid sequences for the 28 species contained the transmembrane domain, the template 6M18 had the closest similarity relative to ACE2 crystal structures, which only contain the ectodomain. The quality of the models was assessed in SWISS-Model for coverage, sequence identity and global model quality estimation. The models were then imported to CHIMERA and the rmsd was calculated between the template structure and each individual model. Additional structural visualizations were generated in Pymol (89).

Human Variants Analysis.

All variants at the 25 residues critical for effective ACE2 binding to SARS-CoV-2-S (101220) were compiled from dbSNP (90), 1KGP (91), Topmed (92), UK10K (93), and CHINAMAP (24). Specific population frequencies were obtained from gnomAD v.2.1.1 (16).

Phylogenetic Reconstruction of the Vertebrate ACE2 Species Tree.

The multiple sequence alignment of 410 ACE2 orthologous protein sequences from mammals, birds, fishes, reptiles, and amphibians was used to generate a gene tree using the maximum likelihood method of reconstruction, as implemented in IQTREE (94). The best-fit model of sequence evolution was determined using ModelFinder (95) and used to generate the species phylogeny. A total of 1,000 bootstrap replicates were used to determine node support using UFBoot (96).

Identifying Sites Undergoing Positive Selection.

Signatures of site-specific positive selection in the ACE2 receptor were explored using CodeML, part of the Phylogenetic Analysis using Maximum Likelihood (PAML) (97) suite of software. Given CodeML’s computational complexity, a smaller subset of mammalian taxa (n = 64; Dataset S1), which included species from all prediction categories mentioned above, was used for selection analyses. To calculate likelihood-derived dN/dS rates (⍵), CodeML utilizes both a species tree and a codon alignment. The species tree for all 64 taxa was calculated using IQTREE (94) and the inferred best-fit model of sequence evolution (JTT+F + R4). This gene topology was generally in agreement with the 410 taxa tree; however, bats were now sister taxa to Perissodactyla. Therefore, all selection analyses were run using both the inferred gene tree and a modified tree with the position of bats manually modified to reflect the 410 taxa topology. All species trees used were unrooted. A codon alignment of the 64 mammals was generated using pal2nal (98) with protein alignments generated with Clustal Omega (82) and their respective coding sequences.

Site models M7 (null model) and M8 (alternative model) were used to identify ACE2 sites undergoing positive selection in mammals. Both M7 and M8 estimate ⍵ using a beta distribution and 10 rate categories per site with ⍵ ≤ 1 (neutral or purifying selection) but with an additional 11th category allowing ⍵ >1 (positive selection) in M8. An LRT calculated as 2*(lnLalt – lnLnull), comparing the fit of both null and alternative model likelihoods was carried out, with a P value calculated assuming a χ2 distribution. Sites showing evidence of positive selection were identified by a significant (>0.95) BEB score and validated by visual inspection of the protein alignment. To explore order-specific instances of positive selection, separate multiple sequence alignments and gene trees for Chiroptera (n = 37), Cetartiodactyla (n = 45), Carnivora (n = 44), Rodentia (n = 46), and Primates (n = 39) were also generated and explored using M7 vs. M8 in CodeML. The M0 model in CodeML was used to explore consistency across parameters inferred maximum likelihood (e.g., transition/transversion rates and branch lengths).

In addition to site models, branch-site model A1 (null model) and model A (alternative model) were also implemented targeting various mammalian orders, specifically Chiroptera, Cetartiodactyla, Rodentia, and Primates, to identify lineage-specific positive selection in the ACE2 receptor sequence. Branch-site Model A1 constrains both the target foreground branch (Carnivora, Chiroptera, Cetartiodactyla, Rodentia, and Primates) and background branches to ⍵ ≤ 1, while the alternative Model A allows positive selection to occur in the foreground branch. Null and alternative models were compared using LRTs as above, with significant BEB sites identified.

We also looked for positively selected sites in the viral spike protein, using coding sequences from 43 SARS-CoV-2, SARS-CoV, and CoV-like viral strains. Protein and codon alignments were generated as above, with the viral species tree inferred using the spike alignment generated with Clustal Omega. Site-test models were applied using CodeML and significant BEB sites identified.

Analysis for Departure from Neutral Evolutionary Rate in ACE2 with PHAST.

Neutral models were trained on the specified species sets (Dataset S4) using the REV nucleotide substitution model implemented in phyloFit using an expectation-maximization algorithm for parameter optimization. The neutral model fit was based on third-codon positions to approximate the neutral evolution rate specific to the ACE2 gene, using a 410-species phylogenetic tree generated by IQTREE as described above and rooted on fishes. The program phyloP was then used to identify codons undergoing accelerated or conserved evolution relative to the neutral model using –features to specify codons, –method LRT –mode CONACC, and –subtree for lineage-specific tests, with P values thus assigned per codon based on an LRT. P values were corrected for multiple testing using the Benjamini–Hochberg method (99) and sites with a corrected P value less than 0.05 were considered significant. PhyloFit and phyloP are both part of the PHAST package v1.4 (100101). In order to assess the relative power among the various clades, we followed a simulation-based protocol (99). Using the program phyloBoot from PHAST, we generated 1,000 alignments of length 2,415 nucleotides to match the size of the ACE2 codon alignment for different subtree scaling factors (e.g., phyloBoot -L 2415 -n 1000 -t tree.nh -l 1.11 -S Chiroptera mammals.CDS-3.mod -a out_root) (100101). Lambda represents the scale of the departure from neutral evolution in a clade, with lambda less than one indicating conservation and greater than one indicating acceleration. Greater values of lambda indicate greater amounts of acceleration or effect size and thus require less power to detect. We then ran phyloP on these alignments with the same parameters as used to test the ACE2 alignment for each clade and determined the number of accelerated codons at each value of lambda for each clade (SI Appendix, Fig. S8). The simulator generates nucleotide (not amino acid) sequences and is therefore conservative in its estimations of power for acceleration but adequate for defining relative power between clades. These results are concordant with the summed branch lengths identified using tree_doctor from PHAST (100101) for each clade (SI Appendix, Table S2), which is expected as previous analyses found power to detect departures from neutral evolution to scale with subtree length (99).

Data Availability.

All accession numbers or genome availability for the 410 species used in this study are listed in Dataset S1. This study made use of ACE2 protein sequences previously available from NCBI protein database (n = 287) and ACE2 sequences extracted from genomes previously available from NCBI assembly (n = 106) (102). ACE2 sequences were extracted from the genomes of Bowhead whale (available at http://alfred.liv.ac.uk/downloads/bowhead_whale/bowhead_whale_scaffolds.zip), velvety free-tailed bat (available at https://vgp.github.io/genomeark/Molossus_molossus/), greater mouse-eared bat (available at https://vgp.github.io/genomeark/Myotis_myotis/), Kuhl’s pipistrelle (available at https://vgp.github.io/genomeark/Pipistrellus_kuhlii/), scimitar oryx (available at https://www.dnazoo.org/assemblies/Oryx_dammah), and white-bellied pangolin (available at https://www.dnazoo.org/assemblies/Phataginus_tricuspis). The ACE2 sequences of Pratt’s roundleaf bat, Pearson’s horseshoe bat, greater short-nosed fruit bat, and Indian false vampire were submitted to NCBI under the accession nos. MT515621MT515624. The ACE2 sequences of dama gazelle, Sunda clouded leopard, clouded leopard, maned wolf, bush dog, European mink, and black-footed ferret were also submitted to NCBI and are available under the accession nos. MT560518MT560524.

Acknowledgments

We thank Lawrence Stern for helpful discussions on homology modeling. We thank Pavel Dobrynin, Paul Frandsen, Taylor Hains, and Sergei Kliver for extracting and contributing ACE2 sequences from recently sequenced genomes. We also thank Alice Mouton of the Fonds de la Recherche Scientifique at the Conservation Genetics Laboratory, University of Liege, for contributing the ACE2 sequence from the European mink genome and Christine Fournier-Chambrillon of the Groupe de Recherche et d’Etude pour la Gestion de l’Environnement and Ingrid Marchand of the Ligue pour la Protection des Oiseaux, who provided the biological material allowing the sequencing of a European mink captured as part of the conservation program LIFE VISON (LIFE 16 NAT/EN/000872) in France. We thank Shirley Xue Li and Kate Megquier for help in data compilation. We thank Pierre Comizzoli, Budhan Pukazhenthi, and Nucharin Songasasen for valuable comments that improved the manuscript. This work was supported by the Robert and Rosabel Osborne Endowment (H.A.L.). K.L.-T. is the recipient of a Distinguished Professor award from the Swedish Research Council and Knut and Alice Wallenberg foundation. E.C.T. is funded by an Irish Research Council Laureate Award. K.C.K. is supported by a University of California, San Francisco Discovery Fellowship and the Gladstone Institutes. K.S.P. is supported by the Roddenberry Foundation and the Gladstone Institutes. G.M.H. is funded by an Ad Astra Fellowship at University College Dublin. E.K.K., D.P.G., and R.S. were supported by the National Human Genome Research Institute of the National Institutes of Health (grant R01HG008742) and the National Science Foundation (grant 2029774). H.Z. was supported by the National Natural Science Foundation of China (grant 31722051). The research conducted in this study was coordinated as part of the Earth BioGenome Project, which includes the Genome 10K Consortium, Bat1K, Zoonomia, and the Vertebrate Genomes Project.

Footnotes

  • 1J.D., G.M.H., K.C.K., C.A.P., and N.S.P. contributed equally to this work.
  • 2To whom correspondence may be addressed. Email: Lewin@ucdavis.edu.
  • Author contributions: J.D., C.A.P., E.C.T., E.K.K., and H.A.L. designed research; J.D., G.M.H., K.C.K., C.A.P., N.S.P., M.C., M.H., K.-P.K., H.Z., D.P.G., and R.S. performed research; J.D., G.M.H., K.C.K., C.A.P., N.S.P., M.C., M.H., K.-P.K., A.R.P., K.S.P., K.L.-T., E.C.T., E.K.K., and H.A.L. analyzed data; and J.D., G.M.H., K.C.K., C.A.P., N.S.P., M.C., M.H., K.-P.K., A.R.P., D.P.G., K.S.P., O.A.R., M.T.N., K.L.-T., E.C.T., E.K.K., and H.A.L. wrote the paper.
  • The authors declare no competing interest.
  • This article is a PNAS Direct Submission.
  • This article contains supporting information online at https://www.pnas.org/lookup/suppl/doi:10.1073/pnas.2010146117/-/DCSupplemental.
  • Copyright © 2020 the Author(s). Published by PNAS.

This open access article is distributed under Creative Commons Attribution License 4.0 (CC BY).

References

  1. 1.
    1.  P. Zhou et al.
    , A pneumonia outbreak associated with a new coronavirus of probable bat origin. Nature 579, 270–273 (2020).CrossRefPubMedGoogle Scholar
  2. 2.
    1.  G. Lu, 
    2. Q. Wang, 
    3. G. F. Gao
    , Bat-to-human: Spike features determining “host jump” of coronaviruses SARS-CoV, MERS-CoV, and beyond. Trends Microbiol. 23, 468–478 (2015).CrossRefPubMedGoogle Scholar
  3. 3.
    1.  C. Shan et al.
    , Infection with novel coronavirus (SARS-CoV-2) causes pneumonia in the Rhesus macaques. Cell Res. 30, 670–677 (2020).Google Scholar
  4. 4.
    1.  H. Laude, 
    2. K. Van Reeth, 
    3. M. Pensaert
    , Porcine respiratory coronavirus: Molecular features and virus-host interactions. Vet. Res. 24, 125–150 (1993).PubMedGoogle Scholar
  5. 5.
    1.  L. J. Saif
    , Bovine respiratory coronavirus. Vet. Clin. North Am. Food Anim. Pract. 26, 349–364 (2010).CrossRefPubMedGoogle Scholar
  6. 6.
    1.  L. Vijgen et al.
    , Complete genomic sequence of human coronavirus OC43: Molecular clock analysis suggests a relatively recent zoonotic coronavirus transmission event. J. Virol. 79, 1595–1604 (2005).Abstract/FREE Full TextGoogle Scholar
  7. 7.
    1.  T. T.-Y. Lam et al.
    , Identifying SARS-CoV-2-related coronaviruses in Malayan pangolins. Nature 583, 282–285 (2020).Google Scholar
  8. 8.
    1. United States Department of Agriculture Animal and Plant Health Inspection Service
    , USDA statement on the confirmation of COVID-19 in a tiger in New York. https://www.aphis.usda.gov/aphis/newsroom/news/sa_by_date/sa-2020/ny-zoo-covid-19. Accessed 13 April 2020.Google Scholar
  9. 9.
    1.  W. Chen et al.
    , SARS-associated coronavirus transmitted from human to pig. Emerg. Infect. Dis. 11, 446–448 (2005).CrossRefPubMedGoogle Scholar
  10. 10.
    1.  J. Sun et al.
    , COVID-19: Epidemiology, evolution, and cross-disciplinary perspectives. Trends Mol. Med. 26, 483–495 (2020).Google Scholar
  11. 11.
    1.  W. Li et al.
    , Angiotensin-converting enzyme 2 is a functional receptor for the SARS coronavirus. Nature 426, 450–454 (2003).CrossRefPubMedGoogle Scholar
  12. 12.
    1.  J. Lan et al.
    , Structure of the SARS-CoV-2 spike receptor-binding domain bound to the ACE2 receptor. Nature 581, 215–220 (2020).Google Scholar
  13. 13.
    1.  V. B. Patel, 
    2. J.-C. Zhong, 
    3. M. B. Grant, 
    4. G. Y. Oudit
    , Role of the ACE2/Angiotensin 1-7 axis of the renin-angiotensin system in heart failure. Circ. Res. 118, 1313–1326 (2016).Abstract/FREE Full TextGoogle Scholar
  14. 14.
    1.  Y. Feng et al.
    , Angiotensin-converting enzyme 2 overexpression in the subfornical organ prevents the angiotensin II-mediated pressor and drinking responses and is associated with angiotensin II type 1 receptor downregulation. Circ. Res. 102, 729–736 (2008).Abstract/FREE Full TextGoogle Scholar
  15. 15.
    1.  V. S. Raj et al.
    , Dipeptidyl peptidase 4 is a functional receptor for the emerging human coronavirus-EMC. Nature 495, 251–254 (2013).CrossRefPubMedGoogle Scholar
  16. 16.
    1.  K. J. Karczewski et al.
    , The mutational constraint spectrum quantified from variation in 141,456 humans. Nature 581, 434–443 (2020).CrossRefGoogle Scholar
  17. 17.
    1.  E. W. Stawiski et al
    ., Human ACE2 receptor polymorphisms predict SARS-CoV-2 susceptibility. bioRxiv:10.1101/2020.04.07.024752 (13 April 2020).Google Scholar
  18. 18.
    1.  F. Li
    , Receptor recognition and cross-species infections of SARS coronavirus. Antiviral Res. 100, 246–254 (2013).CrossRefPubMedGoogle Scholar
  19. 19.
    1.  F. Li, 
    2. W. Li, 
    3. M. Farzan, 
    4. S. C. Harrison
    , Structure of SARS coronavirus spike receptor-binding domain complexed with receptor. Science 309, 1864–1868 (2005).Abstract/FREE Full TextGoogle Scholar
  20. 20.
    1.  J. Shang et al.
    , Structural basis of receptor recognition by SARS-CoV-2. Nature 581, 221–224 (2020).PubMedGoogle Scholar
  21. 21.
    1.  T. Zhang, 
    2. Q. Wu, 
    3. Z. Zhang
    , Probable pangolin origin of SARS-CoV-2 associated with the COVID-19 outbreak. Curr. Biol. 30, 1346–1351.e2 (2020).CrossRefPubMedGoogle Scholar
  22. 22.
    1.  Z. Liu et al.
    , Composition and divergence of coronavirus spike proteins and host ACE2 receptors predict potential intermediate hosts of SARS-CoV-2. J. Med. Virol. 92, 595–601 (2020).Google Scholar
  23. 23.
    1.  M. Hussain et al.
    , Structural variations in human ACE2 may influence its binding with SARS-CoV-2 spike protein. J. Med. Virol., doi:10.1002/jmv.25832 (2020).CrossRefPubMedGoogle Scholar
  24. 24.
    1.  Y. Cao et al.
    , Comparative genetic analysis of the novel coronavirus (2019-nCoV/SARS-CoV-2) receptor ACE2 in different populations. Cell Discov. 6, 11 (2020).CrossRefPubMedGoogle Scholar
  25. 25.
    1.  E. Benetti et al.
    , ACE2 gene variants may underlie interindividual variability and susceptibility to COVID-19 in the Italian population. Eur. J. Hum. Genet., doi:10.1038/s41431-020-0691-z (2020).CrossRefGoogle Scholar
  26. 26.
    1.  H. Othman et al.
    , Interaction of the spike protein RBD from SARS-CoV-2 with ACE2: Similarity with SARS-CoV, hot-spot analysis and effect of the receptor polymorphism. Biochem. Biophys. Res. Commun. 527, 702–708 (2020).Google Scholar
  27. 27.
    1.  K. K. Chan et al
    ., Engineering human ACE2 to optimize binding to the spike protein of SARS coronavirus 2. Science, doi:10.1126/science.abc0870 (2020).AbstractGoogle Scholar
  28. 28.
    1.  S. J. Anthony et al.; PREDICT Consortium
    , Global patterns in coronavirus diversity. Virus Evol. 3, vex012 (2017).CrossRefGoogle Scholar
  29. 29.
    1.  G. Y. Oudit, 
    2. M. A. Crackower, 
    3. P. H. Backx, 
    4. J. M. Penninger
    , The role of ACE2 in cardiovascular physiology. Trends Cardiovasc. Med. 13, 93–101 (2003).CrossRefPubMedGoogle Scholar
  30. 30.
    1.  D. Jebb et al.
    , Six reference-quality genomes reveal evolution of bat adaptations. Nature 583, 578–584 (2020).Google Scholar
  31. 31.
    1.  K.-P. Koepfli, 
    2. B. Paten, 
    3. S. J. O’Brien; Genome 10K Community of Scientists
    , The genome 10K project: A way forward. Annu. Rev. Anim. Biosci. 3, 57–111 (2015).Google Scholar
  32. 32.
    1.  M. Cho, 
    2. H. S. Son
    , Prediction of cross-species infection propensities of viruses with receptor similarity. Infect. Genet. Evol. 73, 71–80 (2019).Google Scholar
  33. 33.
    1.  S. A. Kerr et al.
    , Computational and functional analysis of the virus-receptor interface reveals host range trade-offs in New World arenaviruses. J. Virol. 89, 11643–11653 (2015).Abstract/FREE Full TextGoogle Scholar
  34. 34.
    1.  M. S. Maginnis
    , Virus-receptor interactions: The key to cellular invasion. J. Mol. Biol. 430, 2590–2611 (2018).CrossRefGoogle Scholar
  35. 35.
    1.  M. Letko, 
    2. A. Marzi, 
    3. V. Munster
    , Functional assessment of cell entry and receptor usage for SARS-CoV-2 and other lineage B betacoronaviruses. Nat. Microbiol. 5, 562–569 (2020).Google Scholar
  36. 36.
    1.  E. S. Brielle, 
    2. D. Schneidman-Duhovny, 
    3. M. Linial
    , The SARS-CoV-2 exerts a distinctive strategy for interacting with the ACE2 human receptor. Viruses 12, 497 (2020).CrossRefGoogle Scholar
  37. 37.
    1.  J. Luan, 
    2. Y. Lu, 
    3. X. Jin, 
    4. L. Zhang
    , Spike protein recognition of mammalian ACE2 predicts the host range and an optimized ACE2 for SARS-CoV-2 infection. Biochem. Biophys. Res. Commun. 526, 165–169 (2020).Google Scholar
  38. 38.
    1.  A. D. Melin, 
    2. M. C. Janiak, 
    3. F. Marrone, 
    4. P. S. Arora, 
    5. J. P. Higham
    , Comparative ACE2 variation and primate COVID-19 risk. bioRxiv:10.1101/2020.04.09.034967 (12 April 2020).Google Scholar
  39. 39.
    1.  Y. Qiu et al.
    , Predicting the angiotensin converting enzyme 2 (ACE2) utilizing capability as the receptor of SARS-CoV-2. Microbes Infect. 22, 221–225 (2020).Google Scholar
  40. 40.
    1.  Y. Wan, 
    2. J. Shang, 
    3. R. Graham, 
    4. R. S. Baric, 
    5. F. Li
    , Receptor recognition by the novel coronavirus from Wuhan: An analysis based on decade-long structural studies of SARS coronavirus. J. Virol. 94, e00127-20 (2020).CrossRefGoogle Scholar
  41. 41.
    1.  A. Demogines, 
    2. M. Farzan, 
    3. S. L. Sawyer
    , Evidence for ACE2-utilizing coronaviruses (CoVs) related to severe acute respiratory syndrome CoV in bats. J. Virol. 86, 6350–6353 (2012).Abstract/FREE Full TextGoogle Scholar
  42. 42.
    1.  R. Cagliani, 
    2. D. Forni, 
    3. M. Clerici, 
    4. M. Sironi
    , Computational inference of selection underlying the evolution of the novel coronavirus, severe acute respiratory syndrome coronavirus 2. J. Virol. 94, e00411-20 (2020).Google Scholar
  43. 43.
    1.  V. J. Munster et al
    ., Respiratory disease and virus shedding in rhesus macaques inoculated with SARS-CoV-2. bioRxiv:10.1101/2020.03.21.001628 (12 April 2020).Google Scholar
  44. 44.
    1.  B. Rockx et al.
    , Comparative pathogenesis of COVID-19, MERS, and SARS in a nonhuman primate model. Science 368, 1012–1015 (2020).Abstract/FREE Full TextGoogle Scholar
  45. 45.
    1.  J. Shi et al.
    , Susceptibility of ferrets, cats, dogs, and other domesticated animals to SARS-coronavirus 2. Science 368, 1016–1020 (2020).Abstract/FREE Full TextGoogle Scholar
  46. 46.
    1.  P. J. Halfmann et al.
    , Transmission of SARS-CoV-2 in domestic cats. N. Engl. J. Med., doi:10.1056/NEJMc2013400 (2020).CrossRefGoogle Scholar
  47. 47.
    1.  J. F.-W. Chan et al.
    , Simulation of the clinical and pathological manifestations of coronavirus disease 2019 (COVID-19) in golden Syrian hamster model: Implications for disease pathogenesis and transmissibility. Clin. Infect. Dis., doi:10.1093/cid/ciaa325 (2020).CrossRefPubMedGoogle Scholar
  48. 48.
    1.  T. H. C. Sit et al.
    , Infection of dogs with SARS-CoV-2. Nature, doi:10.1038/s41586-020-2334-5 (2020).CrossRefGoogle Scholar
  49. 49.
    1.  K. Schlottau et al.
    , SARS-CoV-2 in fruit bats, ferrets, pigs, and chickens: An experimental transmission study. The Lancet Microbe, doi:10.1016/S2666-5247(20)30089-6 (2020).CrossRefGoogle Scholar
  50. 50.
    1.  Y.-I. Kim et al.
    , Infection and rapid transmission of SARS-CoV-2 in ferrets. Cell Host Microbe 27, 704–709.e2 (2020).Google Scholar
  51. 51.
    1.  M. Richard et al.
    , SARS-CoV-2 is transmitted via contact and via the air between ferrets. Nat. Commun. 11, 3496 (2020).Google Scholar
  52. 52.
    1.  T. Enkirch, 
    2. V. von Messling
    , Ferret models of viral pathogenesis. Virology 479–480, 259–270 (2015).Google Scholar
  53. 53.
    1.  B. E. E. Martina et al.
    , Virology: SARS virus infection of cats and ferrets. Nature 425, 915 (2003).CrossRefPubMedGoogle Scholar
  54. 54.
    1.  T. Gramberg et al.
    , LSECtin interacts with filovirus glycoproteins and the spike protein of SARS coronavirus. Virology 340, 224–236 (2005).CrossRefPubMedGoogle Scholar
  55. 55.
    1.  A. C. Walls et al.
    , Structure, function, and antigenicity of the SARS-CoV-2 spike glycoprotein. Cell 181, 281–292.e6 (2020).CrossRefPubMedGoogle Scholar
  56. 56.
    1.  K. P. Alekseev et al.
    , Bovine-like coronaviruses isolated from four species of captive wild ruminants are homologous to bovine coronaviruses, based on complete genomic sequences. J. Virol. 82, 12422–12431 (2008).Abstract/FREE Full TextGoogle Scholar
  57. 57.
    1.  K. A. Mihindukulasuriya, 
    2. G. Wu, 
    3. J. St Leger, 
    4. R. W. Nordhausen, 
    5. D. Wang
    , Identification of a novel coronavirus from a beluga whale by using a panviral microarray. J. Virol. 82, 5084–5088 (2008).Abstract/FREE Full TextGoogle Scholar
  58. 58.
    1.  F. S. B. Kibenge, 
    2. M. G. Godoy
    3.  H. Schütze, 
    “Coronaviruses in aquatic organisms” in Aquaculture Virology, F. S. B. Kibenge, M. G. Godoy, Eds. (Academic Press, 2016), pp. 327–335.Google Scholar
  59. 59.
    1.  P. C. Y. Woo et al.
    , Discovery of a novel bottlenose dolphin coronavirus reveals a distinct species of marine mammal coronavirus in Gammacoronavirus. J. Virol. 88, 1318–1331 (2014).Abstract/FREE Full TextGoogle Scholar
  60. 60.
    1.  M. Hoffmann et al.
    , SARS-CoV-2 cell entry depends on ACE2 and TMPRSS2 and is blocked by a clinically proven protease inhibitor. Cell 181, 271–280.e8 (2020).CrossRefPubMedGoogle Scholar
  61. 61.
    1.  A. Banerjee et al.
    , Novel insights into immune systems of bats. Front. Immunol. 11, 26 (2020).Google Scholar
  62. 62.
    1.  J. Harcourt et al.
    , Severe acute respiratory syndrome coronavirus 2 from patient with coronavirus disease, United States. Emerg. Infect. Dis. 26, 1266–1273 (2020).Google Scholar
  63. 63.
    1.  M. Hoffmann et al.
    , Differential sensitivity of bat cells to infection by enveloped RNA viruses: Coronaviruses, paramyxoviruses, filoviruses, and influenza viruses. PLoS One 8, e72942 (2013).CrossRefPubMedGoogle Scholar
  64. 64.
    1.  B. Delmas et al.
    , Aminopeptidase N is a major receptor for the entero-pathogenic coronavirus TGEV. Nature 357, 417–420 (1992).CrossRefPubMedGoogle Scholar
  65. 65.
    1.  Y. Li et al
    ., Potential host range of multiple SARS-like coronaviruses and an improved ACE2-Fc variant that is potent against both SARS-CoV-2 and SARS-CoV-1. bioRxiv:10.1101/2020.04.10.032342 (18 May 2020).Google Scholar
  66. 66.
    1.  S. Temmam, 
    2. A. Barbarino, 
    3. D. Maso, 
    4. S. Behillil, 
    5. V. Enouf
    , Absence of SARS-CoV-2 infection in cats and dogs in close contact with a cluster of COVID-19 patients in a veterinary campus. bioRxiv:10.1101/2020.04.07.029090 (9 April 2020).Google Scholar
  67. 67.
    1.  K. Xiao et al.
    , Isolation of SARS-CoV-2-related coronavirus from Malayan pangolins. Nature 583, 286–289 (2020).Google Scholar
  68. 68.
    1.  X. Li et al.
    , Evolutionary history, potential intermediate animal host, and cross-species analyses of SARS-CoV-2. J. Med. Virol. 92, 602–611 (2020).CrossRefGoogle Scholar
  69. 69.
    1.  J. Miao, 
    2. L. S. Chard, 
    3. Z. Wang, 
    4. Y. Wang
    , Syrian hamster as an animal model for the study on infectious diseases. Front. Immunol. 10, 2329 (2019).CrossRefPubMedGoogle Scholar
  70. 70.
    1. IUCN
    , The IUCN Red List of Threatened Species, Version 2019-2. https://www.iucnredlist.org/. Accessed 13 April 2020.Google Scholar
  71. 71.
    1.  B. A. Braun, 
    2. A. Marcovitz, 
    3. J. G. Camp, 
    4. R. Jia, 
    5. G. Bejerano
    , Mx1 and Mx2 key antiviral proteins are surprisingly lost in toothed whales. Proc. Natl. Acad. Sci. U.S.A. 112, 8036–8040 (2015).Abstract/FREE Full TextGoogle Scholar
  72. 72.
    1.  R. R. Colwell, 
    2. S. Belkin
    1.  A. Bosch, 
    2. F. Xavier Abad, 
    3. R. M. Pintó, 
    “Human pathogenic viruses in the marine environment” in Oceans and Health: Pathogens in the Marine Environment, R. R. Colwell, S. Belkin, Eds. (Springer, Boston, MA, 2005), pp. 109–131.Google Scholar
  73. 73.
    1.  C. Copeland
    , “Cruise ship pollution: background, laws and regulations, and key issues” (Tech. Rep. RL32450, Congressional Research Service, The Library of Congress, 2005).Google Scholar
  74. 74.
    1.  K. V. K. Gilardi et al.
    Best Practice Guidelines for Health Monitoring and Disease Control in Great Ape Populations, (IUCN SSC Primate Specialist Group, IUCN, Gland, Switzerland, 2015).Google Scholar
  75. 75.
    1.  A. Estrada et al.
    , Impending extinction crisis of the world’s primates: Why primates matter. Sci. Adv. 3, e1600946 (2017).FREE Full TextGoogle Scholar
  76. 76.
    1.  T. R. Gillespie, 
    2. F. H. Leendertz
    , COVID-19: Protect great apes during human pandemics. Nature 579, 497 (2020).Google Scholar
  77. 77.
    1.  J. Johnson, 
    2. A. Moresco, 
    3. S. Han
    , SARS-COV-2 considerations and precautions. https://zahp.aza.org/wp-content/uploads/2020/04/AZA-Small-Carnivore-TAG-SARS-CoV-Statement_8Apr2020.pdf. Accessed 8 April 2020.Google Scholar
  78. 78.
    1.  A. Lecu, 
    2. M. Bertelsen, 
    3. C. Walzer; EAZWV Infectious Diseases Working Group
    , “Science-based facts & knowledge about wild animals, zoos, and SARS-CoV-2 virus” in Transmissible Diseases Handbook, (European Association of Zoo and Wildlife Veterinarians, 2020).Google Scholar
  79. 79.
    1. NCBI Resource Coordinators
    , Database resources of the national center for biotechnology information. Nucleic Acids Res. 44, D7–D19 (2016).CrossRefPubMedGoogle Scholar
  80. 80.
    1.  M. Stanke, 
    2. B. Morgenstern
    , AUGUSTUS: A web server for gene prediction in eukaryotes that allows user-defined constraints. Nucleic Acids Res. 33, W465–W467 (2005).CrossRefPubMedGoogle Scholar
  81. 81.
    1.  V. Sharma, 
    2. P. Schwede, 
    3. M. Hiller
    , CESAR 2.0 substantially improves speed and accuracy of comparative gene annotation. Bioinformatics 33, 3985–3987 (2017).Google Scholar
  82. 82.
    1.  F. Sievers, 
    2. D. G. Higgins
    , Clustal Omega, accurate alignment of very large numbers of sequences. Methods Mol. Biol. 1079, 105–116 (2014).CrossRefPubMedGoogle Scholar
  83. 83.
    1.  R. C. Edgar
    , MUSCLE: Multiple sequence alignment with high accuracy and high throughput. Nucleic Acids Res. 32, 1792–1797 (2004).CrossRefPubMedGoogle Scholar
  84. 84.
    1.  J. S. Papadopoulos, 
    2. R. Agarwala
    , COBALT: Constraint-based alignment tool for multiple protein sequences. Bioinformatics 23, 1073–1079 (2007).CrossRefPubMedGoogle Scholar
  85. 85.
    1.  E. F. Pettersen et al.
    , UCSF Chimera–A visualization system for exploratory research and analysis. J. Comput. Chem. 25, 1605–1612 (2004).CrossRefPubMedGoogle Scholar
  86. 86.
    1.  M. V. Shapovalov, 
    2. R. L. Dunbrack Jr.
    , A smoothed backbone-dependent rotamer library for proteins derived from adaptive kernel density estimates and regressions. Structure 19, 844–858 (2011).CrossRefPubMedGoogle Scholar
  87. 87.
    1.  A. Waterhouse et al.
    , SWISS-MODEL: Homology modelling of protein structures and complexes. Nucleic Acids Res. 46, W296–W303 (2018).CrossRefPubMedGoogle Scholar
  88. 88.
    1.  R. Yan et al.
    , Structural basis for the recognition of SARS-CoV-2 by full-length human ACE2. Science 367, 1444–1448 (2020).Abstract/FREE Full TextGoogle Scholar
  89. 89.
    1. PyMOL
    , The PyMOL molecular graphics system (Version 2.0 Schrödinger, LLC, 2020).Google Scholar
  90. 90.
    1.  S. T. Sherry et al.
    , dbSNP: The NCBI database of genetic variation. Nucleic Acids Res. 29, 308–311 (2001).CrossRefPubMedGoogle Scholar
  91. 91.
    1.  A. Auton et al.; 1000 Genomes Project Consortium
    , A global reference for human genetic variation. Nature 526, 68–74 (2015).CrossRefPubMedGoogle Scholar
  92. 92.
    1. NHLBI
    , Trans-omics for precision medicine: About TOPMed. https://www.nhlbiwgs.org/. Accessed 14 April 2020.Google Scholar
  93. 93.
    1. UK10K Consortium
    , The UK10K project identifies rare variants in health and disease. Nature 526, 82–90 (2015).CrossRefPubMedGoogle Scholar
  94. 94.
    1.  B. Q. Minh et al.
    , IQ-TREE 2: New models and efficient methods for phylogenetic inference in the genomic era. Mol. Biol. Evol. 37, 1530–1534 (2020).Google Scholar
  95. 95.
    1.  S. Kalyaanamoorthy, 
    2. B. Q. Minh, 
    3. T. K. F. Wong, 
    4. A. von Haeseler, 
    5. L. S. Jermiin
    , ModelFinder: Fast model selection for accurate phylogenetic estimates. Nat. Methods 14, 587–589 (2017).CrossRefPubMedGoogle Scholar
  96. 96.
    1.  D. T. Hoang, 
    2. O. Chernomor, 
    3. A. von Haeseler, 
    4. B. Q. Minh, 
    5. L. S. Vinh
    , UFBoot2: Improving the ultrafast bootstrap approximation. Mol. Biol. Evol. 35, 518–522 (2018).CrossRefPubMedGoogle Scholar
  97. 97.
    1.  Z. Yang
    , PAML 4: Phylogenetic analysis by maximum likelihood. Mol. Biol. Evol. 24, 1586–1591 (2007).CrossRefPubMedGoogle Scholar
  98. 98.
    1.  M. Suyama, 
    2. D. Torrents, 
    3. P. Bork
    , PAL2NAL: Robust conversion of protein sequence alignments into the corresponding codon alignments. Nucleic Acids Res. 34, W609–W612 (2006).CrossRefPubMedGoogle Scholar
  99. 99.
    1.  K. S. Pollard, 
    2. M. J. Hubisz, 
    3. K. R. Rosenbloom, 
    4. A. Siepel
    , Detection of nonneutral substitution rates on mammalian phylogenies. Genome Res. 20, 110–121 (2010).Abstract/FREE Full TextGoogle Scholar
  100. 100.
    1.  M. J. Hubisz, 
    2. K. S. Pollard, 
    3. A. Siepel
    , PHAST and RPHAST: Phylogenetic analysis with space/time models. Brief. Bioinform. 12, 41–51 (2011).CrossRefPubMedGoogle Scholar
  101. 101.
    1.  R. Ramani, 
    2. K. Krumholz, 
    3. Y.-F. Huang, 
    4. A. Siepel
    , PhastWeb: A web interface for evolutionary conservation scoring of multiple sequence alignments using phastCons and phyloP. Bioinformatics 35, 2320–2322 (2019).Google Scholar
  102. 102.
    1.  E. W. Sayers et al.
    , Database resources of the national center for biotechnology information. Nucleic Acids Res. 47, D23–D28 (2019).CrossRefGoogle Scholar

A hugely important film Produced, Edited, Filmed, and Directed by Emily Stanford – A product of her year of travel around the world on a Watson fellowship to study people’s perception of bats. Produced before Covid-19, it could not be more timely.
Please watch and share widely!!!


by Amy Fraenkel – Executive Secretary of the United Nations’ Convention on the Conservation of Migratory Species of Wild Animals
https://www.cms.int/en/news/opinion-far-being-our-enemies-bats-need-protection-now-more-ever

Blasius’ Horseshoe Bat (Rhinolophus blasii) © Mounir Abi-Said, Lebanon

BONN (IDN) – As efforts are stepping up around the world to prevent the further spread of the coronavirus disease (COVID-19), there are alarming reports that some communities and governmental authorities are targeting the wrong enemy:  bats.  

Not only will killing bats not stop COVID-19; it could also do irreparable harm to a mammal which poses no risk to human health in its natural environment, and which provides enormous benefits including pollination, seed dispersal and pest control.  

First, let’s look at what we know. Bats do not spread COVID-19. COVID-19 is being transmitted from humans to other humans. Virologists are in total agreement that the spread of the virus across the planet has been due to human to human rather than animal to human contact.  Moreover, there is no evidence that bats infected humans with COVID-19 to begin with. Inaccurate reports suggesting otherwise may be contributing to the ill-advised killing of bats.  

Second, scientific investigations are still ongoing as to the exact origins of COVID-19. There is consensus that COVID-19 is one of a class of “zoonotic” diseases – diseases that are initially transmitted from animals to humans.  However, it is how and why this likely occurred that is important, so that the right preventative measures can be taken in the future.  

One focus of the investigations is on the so-called “wet market” in Wuhan, China, which sells live animals, pigs, poultry and sea food — as well as many types of wild animals. Rodrigo Medellin, who serves on the Scientific Council of the Convention on the Conservation of Migratory Species of Wild Animals (CMS), and is Co-Chair of the IUCN Bat Specialist Group, is calling for an assessment of the risks of trading in live and dead specimens of animals in such markets. Conditions there are thought to be conducive to the spillover of viruses between different species, ultimately resulting in a mutation that is carried and transferred by humans, as is the case with COVID-19.      

Zoonotic diseases account for approximately 60 per cent of all known infectious diseases in humans. While some zoonotic diseases have been linked to viruses in bats, bats themselves are not the problem. Bats harbor viruses, but so do other species, including humans. There are millions of viruses in the world, most of which are beneficial. The cause of zoonotic diseases in people is not the existence of viruses in wildlife, but the kinds of human interactions with wildlife that can result in these transfers.  

Some scientists also point to human destruction and encroachment of natural ecosystems as another culprit in the cause of zoonotic diseases. Various studies confirm that the conservation of wild species of animals and their habitats will help reduce the occurrence of such diseases in the future.  

There are some 1,400 bat species living in the wild around the world. Many have adapted to urban environments, living in backyard gardens, urban parks and even roosting under bridges, without posing the slightest threat to their human neighbors. But with destruction of their natural habitat and centuries of negative associations, superstitions, myths and legends, many bat species are in danger of extinction. Dozens of bat species are protected by CMS, and particularly by a specific agreement covering most   European countries known, fittingly, as EUROBATS. But much more needs to be done to ensure the survival of bats around the world.    

This is not the first time that in a state of panic, humans have looked for quick but misplaced solutions which can cause significant damage to natural habitats and species. At the height of the 2006 avian influenza outbreak, there were calls for widespread culling of migratory waterbirds and the draining of their wetland habitats.  In fact, wild birds were mainly victims of the outbreak, not its cause, which was found to be domestic fowl rearing and their trade.  

The most urgent action needed to combat COVID-19 is to stop its transmission, which is from humans to humans. In the longer term, we need to examine and stop specific human practices and uses of wild animals, and the widespread destruction of natural habitats, in order to prevent another such terrible event in the future.  

Amy Fraenkel is the Executive Secretary of the United Nations’ Convention on the Conservation of Migratory Species of Wild Animals


Yolo County bats are no cause for concern.
by Carlos Guerrero cguerrero@dailydemocrat.com
May 6, 2020 11:45 am

As the weather is warming, more and more bats will be returning to Yolo County from their winter migration. But is that a cause for concern for the area?

A negative stigma has always followed bats stemming from fictional associations with vampires to nonfictional links to rabies and coronaviruses. A recharged villainization is taking place thanks to the connections between the outbreak of COVID-19 and Chinese Horseshoe bats.

“This villainization of bats is not new, it’s just much worse right now because of the current coronavirus situation,” said Nistara Randhawa, a veterinary epidemiologist, and a postdoctoral scholar at the UC Davis One Health Institute. “The problem comes when we go out and start disturbing spaces that bats live.”

Corky Quirk of NorCal Bats feeds a live mealworm to a ‘Big Brown Bat.’ Quirk said she has been fielding questions from people wanting to know if bats spread the coronavirus. MIKE JORY-MEDIA NEWS GROUP ARCHIVES

Corky Quirk, a program coordinator for the Yolo Basin Foundation and a volunteer with the wildlife rescue group, Northern California Bats, said that she has been receiving a variety of calls form people that are concerned about whether or not the bats in North America carry the coronavirus.

“I appreciate when people call and ask,” Quirk said. “Sometimes, people are right, and sometimes they are wrong when they jump to their own conclusions, so I’m glad people are looking for more accurate information.”

If a bat is at your home, Quirk suggests gently nudging them at dusk to make them uncomfortable, so they leave, instead of opting to kill or hurt the animal.

According to Quirk, there are around 45 species of bats in the United States, 25 in California, and 17 in northern California.

Around a fifth of all the world’s mammals are bats.

“The DNA of this current virus may be traced to a species of Horseshoe bat in Asia,” Quirk said. “Bats in the United States evolved away from the common ancestor millions and millions of years ago. They are not even closely related. They just happen to be in the same order of animals.”

Woodland buildings are well known for having bats, as are the ones in Davis and West Sacramento. The positives bats provide far outweigh any potential fears over diseases.

“People should really think about what the bat does,” Randhawa said. “The bats are eating pests and insects keeping the insect population down. In Southern California, we have bats that pollinate. They are extremely valuable to the ecosystem.”

Bats may be more likely to get sick from humans than the other way around.

“No, people should not be concerned if they see a bat,” Randhawa said. “The cases are happening because of human to human transmission. The likelihood of humans giving COVID-19 to bats we don’t quite know, but the likelihood of bats giving it to humans is extremely unlikely because these bats have just evolved differently.”

There is such a concern in the other direction that the United States Fish and Wildlife Service has asked scientists to stop bat studies temporarily, for the animal’s safety.

“In California, they are allowing us to take bats into rescue, but they are asking us not to release them once they have healed”, Quirk said. “I’ve had a bat that was trapped in a building in Woodland for a couple of weeks now. Normally I would let her go, but she will stay with me indefinitely until the research is complete as to whether or not humans can make the bats sick.”

As a part of her work with the Yolo Basin Foundation, Quirk is involved in the Bat Talk and Walk event that takes place in June out in the Yolo Bypass Wildlife Area.

Following a 45-minute indoor presentation on bat natural history, a group will carpool out to the Yolo Bypass Wildlife Area to watch the “flyout” of the largest colony of Mexican free-tailed bats in California. The whole experience takes about three hours.

The event looks to be at risk of not happening this year.

First off out of concern for human health, we are waiting to see what the recommendations are for shelter in place,” Quirk said. “We are also discussing how those events could look different if indeed we are or aren’t able to begin to gather again. Whether it’s fewer people or something like that. We’ve looked into having a virtual walk as well.”

According to the Yolo Basin Foundation’s website, the 2020 Bat Talk and Walk session is on hold due to current shelter in place and social distancing recommendations

.”June is pretty far out, but we are trying to figure out alternatives,” Quirk said. “But there is nothing like seeing the animals fly. So I would be sad if we are not able to share that experience. If virtual is the case, then so be it, but we are hopeful that we will be able to share about the bats.”

But if it were to go on as planned, there should be no concern.

Something like the bat walk would be perfectly safe,” Randahawa said. “Your’e not getting close to the bats, and you’re not doing anything that will transfer anything to them.”


by Sandhya Ramesh 24 April 2020

Researchers explain why ‘mass hysteria’ is uncalled for

Bats are critical for the survival of several ecosystems | Credits: Devna Arora

Bengaluru: A group of 64 chiropterologists or bat researchers, scientists, and conservationists from six Asian nations released a statement Friday expressing concern about increased stigmatisation and killing of bats due to “unverified opinions” on these mammals as the source of Covid-19.

The statement was released in response to rising demands by people to kill or remove bats from human neighbourhoods and other natural habitats they occupy.

In the seven-point statement, the chiropterologists have explained how bats haven’t yet been confirmed as the source of the novel coronavirus (the mammals are considered to be the most likely source, but definitive evidence has not been found yet).

They also discuss how bat viruses cannot directly infect humans and there is no evidence that bat faeces can transmit viruses to people.

The statement lists the ecological benefits and vital functions that bats fulfill in terms of pollination and crop protection. It also clarifies that discovery of bat coronaviruses in two species in an Indian Council of Medical Research study poses no health hazard.

The full text of the statement is below: 

The world is currently battling a pandemic of unprecedented proportions and bats have been prematurely implicated as the source of COVID-19. Recent social media posts and unverified opinions about bats have led to widespread antipathy and fear in the general public. Incidents of the public requesting for removal of bats, destroying bat roosts, bursting crackers or smoking them out and sealing crevices where bats and their pups roost has increased in the last month both in urban and rural areas in India [1,2]. In this challenging time, we, as people involved in bat conservation at different capacities, would like to clarify that bats do not pose a direct human health hazard. On the contrary, we highlight the role of bats in improving the ecosystem, economy and human health. The following points are listed out in this summary and are elaborated. 

1. The exact origin of SARS-CoV-2 or its precursor is not known. It is premature and unfair to blame bats or any other animal for the pandemic. 

2. Scientists strongly suggest that it is highly unlikely for SARS-like viruses to jump directly from bats to humans. Also, there is no evidence of humans contracting coronavirus or any such viruses through the excreta of bats . 

3. The recent report from the Indian Council of Medical Research (ICMR) on the discovery of bat coronaviruses (BtCoV) in two species of South Asian bats poses no known health hazard. The viruses found in the study are different from SARS-CoV-2 and cannot cause COVID-19. 

4. Information on the current, and past zoonotic disease outbreaks suggest that global wildlife trade and/or large-scale industrial livestock farming play an important role in such events. Killing bats and other wild animals, or evicting them from their roosts in retaliation is counterproductive and will not solve any problems. 

5. Bats perform vital ecosystem services. They pollinate the flowers of some mangroves, and many other commercially and culturally important plants. Insect-eating bats are voracious eaters of pest insects in rice, corn, cotton and potentially, tea farms.Therefore, bats benefit ecological and human health, and provide intangible economic benefits. 

6. The society currently needs more awareness about the bats around them in addition to epidemiological facts for a healthy coexistence. We therefore, request media houses and the press to consider possible negative impacts of their statements on bats and other animals before releasing them. 

7. Lastly, we urge the governments of South Asian countries to strengthen the legal framework to protect bats in view of their ecosystem services and their slow breeding capacity. 

On the origin and transmission of SARS-CoV-2 

The actual origin of SARS-CoV-2 is highly debated among scientists. SARS-CoV-2 appears to be similar to another coronavirus RaTG13 found in a species of bat called the Intermediate Horseshoe Bat (Rhinolophus affinis) [3]. However, a recent study has shown that RaTG13 and SARS-CoV-2 diverged 40-70 years ago from each other (a long timespan for the evolution of viruses) and hence the direct transmission of SARS-CoV-2 or its precursor from bats to humans is improbable [4,5]. Moreover, the surface proteins of all SARS-like viruses found in bats cannot bind efficiently to the corresponding receptors of the human lung epithelium which makes direct transmission even more unlikely [4]. 

It is also highly improbable that the faeces of bats pose an immediate health risk to humans and, none of the previous zoonotic disease outbreaks, globally, show any evidence that they were caused due to contact with bat faeces [6,7,8]. However, fungal infections (for eg. Histoplasmosis) may arise from unprotected contact with the faeces of any wild animal, so following basic hygiene rules is advised. 

Coronaviruses in two species of Indian bats 

None of the South Asian bats are proven to be natural reservoirs of SARS-CoV-2. Recently, a study by the Indian Council of Medical Research (ICMR) found bat coronaviruses (BtCoV) in the common Indian Flying Fox (Pteropus medius a.k.a giganteus) and Fulvous Fruit Bat (Rousettus leschenaultii) [9]. However, less than 5% of the screened samples contained this 

BtCoV and, as the study mentions, it is very distantly-related to SARS-CoV-2 and hence cannot cause COVID-19. 

Relationship between bats and zoonotic disease outbreaks 

The real drivers of zoonotic disease outbreaks are predominantly man-made and many animals are carriers of viruses which could potentially spillover to humans. However, in recent times only bats are unfortunately in focus for being reservoirs of viruses. Like any other animal, bats are also reservoirs of many zoonotic viruses. However, being reservoirs does not mean that they spread diseases to humans. In reality, there is very little scientific evidence to prove bats have directly transmitted viruses to humans or caused outbreaks. The only known exception was the Nipah (NiV) outbreak in Bangladesh which was caused through indirect contact between bats and humans. As the cause of the outbreak was identified, it became easy to control and prevent subsequent outbreaks through basic precautionary and mitigation measures [7,10]. Habitat fragmentation, global wildlife trade and wet markets, large-scale industrial farming of wild and domestic animals have synergistic effects in bringing animals in close contact in unsanitary or stressful conditions—ideal conditions for the transmission and evolution of novel zoonotic viruses [11]. Hence, during such outbreaks there is no reason to single out or villainise only bats – whose benefits far outweigh the perceived negativity associated with them. . 

Bats are beneficial for humans and the ecosystem 

Bats perform vital ecosystem services all over the world. Fruit bats help pollinate globally important cash crops like durian [12] and agave (the plant that produces tequila) [13]. In South Asia, the culturally-significant tree Mahua (Madhuca longifolia) appears to be predominantly bat-pollinated [14]. In Nepal, Chiuri (Diploknema butyracea), a multipurpose tree for the rural populace is pollinated by bats [15]. Small fruit bats also pollinate the flowers of mangroves, which is an extremely productive ecosystem and also a natural barrier to coastal erosion and sea surges, thereby forming our first line of defence to natural disasters. Insectivorous bats, on the other hand, voraciously eat pest insects that cause economic losses in rice plantations [16] and also eat mosquitoes. For instance, bats are estimated to save ~800 million USD for cocoa farmers in Indonesia [17] and ~22 billion dollars (annually) for corn farmers in the United States [18] through pest control. The importance of bats as seed dispersers, pollinators and pest controllers, particularly in the region’s important cash crops (like tea) is beginning to be unravelled. Epidemiologically, the unique immune system of bats could provide clues on handling viruses, therefore they should be seen as a solution to disease outbreaks, rather than the problem. 

Concluding remarks 

In view of the above points, we firmly believe that the mass hysteria against bats is unfair and uncalled for. The current pandemic is an outcome of the ongoing ecological destruction, increasing intensification of livestock farming and wildlife trade. We urge people not to believe in news from unverified sources and cause harm to bats in retaliation. Likewise, we request the media to not oversimplify scientific evidence, to emphasise the role of humans in disease outbreaks and to highlight the importance of coexistence with bats in urban landscapes. Bats have been living around us for centuries and we have been disease free wherever bats have been left to their business. Oversimplified or unverified information from the press not only creates unnecessary fear among the public but also pushes decades of conservation efforts backwards which is far more destructive for the ecosystem.. In India, only two species (out of 128) are protected by law, while many other species are more endangered or lack scientific information [19]. In Nepal, too, all species are unprotected, including two species from the National Red List [20] and the same is true for Pakistan. We urge the governments of these countries to reconsider and reinforce the laws governing bat conservation. 

Signatories 

*Email IDs are provided for those who have agreed to be contacted by the media 

1. Rohit Chakravarty, Leibniz Institute for Zoo and Wildlife Research, Berlin, Germany <rohit.chakravarty77@gmail.com> 

2. Baheerathan Murugavel, Indian Institute of Science Education and Research Thiruvananthapuram (IISER TVM), India <baheerathanm@gmail.com> 

3. Dr. Seshadri K S, Indian Institute of Science (IISc) and The Madras Crocodile Bank Trust (MCBT), India <seshadri.ali@gmail.com> 

4. Vidisha Kulkarni, Jain University and GubbiLabs, Bangalore, India 

5. Rajesh Puttaswamaiah, Citizen Scientist & Trustee, Bat Conservation India Trust, Bangalore, India <rajesh@bcit.org.in> 

6. Dr. Vadamalai Elangovan, Babasaheb Bhimrao Ambedkar University, Lucknow, Uttar Pradesh, India <elango70@yahoo.com> 

7. Shriranjani Iyer, Sálim Ali Centre for Ornithology and Natural History (SACON), Anaikatty, Coimbatore, India <shriranjani8@gmail.com> 

8. Aditya Srinivasulu, Biodiversity Research and Conservation Society, Hyderabad, India. <juramaia98@gmail.com> 

9. Dr. Pushpa Raj Acharya, Central Campus of Science and Technology, Mid-Western University, Birendranagar, Surkhet, Nepal <armalepushpa@gmail.com> 

10. Basanta Sharma, Nepal Bats Research and Conservation Union (NeBRCU), Pokhara, Nepal. <basant@nebrcu.org.np> 

11. Dr. T.Ganesh, Senior Fellow, Ashoka Trust for research in Ecology and the Environment(ATREE), Bangalore, India 

12. Sanjeev Baniya, Nepal Bat Research and Conservation Union (NeBRCU), Pokhara, Nepal. <sanjeev.torres19@gmail.com> 

13. Dr. A. Rathinakumar, Madurai Kamaraj University, Madurai, India. <rathinacumar@gmail.com> 

14. Dr. Chetan HC, Assistant Professor, The University of Transdisciplinary Health Sciences and Technology, Centre for Conservation of Natural resources, Bengaluru, India <chetan.hcc@gmail.com> 

15. Dr. R. Ganesan, Ashoka Trust for Research in Ecology and the Environment (ATREE), Bangalore, India 

16. Rohit Chouhan, Wildlife Research Fellow, Department of Wildlife Science, University of Kota, Kota, Rajasthan, India. <rohit333chouhan@gmail.com> 

17. Kaushik N, Madurai Kamaraj University, Madurai, India <kaushiknarayanan93@gmail.com> 

18. Dr. Sumit Dookia, Assistant Professor, University School of Environment Management, Guru Gobind Singh Indraprastha University, New Delhi, India <sumitdookia@gmail.com> 

19. Aishanya Sarma, Conservation Initiatives, Assam, India <aishanyasarma@gmail.com> 

20. Kasturi Saha, Indian Institute of Science (IISc), Bangalore, India <kasturisaha@iisc.ac.in> 

21. Ram Mohan, Indian Institute of Science Education and Research Pune (IISER Pune), India <rmmhn62@gmail.com> 

22. Tariq Ahmed Shah, Wildlife Biology & Taxonomy Lab, Osmania University, Hyderabad, India. <tariqahmed143@gmail.com> 

23. Devna Arora, Rehabber’s Den, Pune, India <devna@rehabbersden.org> 

24. Harish Prakash, Indian Institute of Science (IISc), Bangalore, India <harishp@iisc.ac.in> 

25. Dr. Parvathy Venugopal, School of Biological Sciences, University of Bristol, United Kingdom. <pvparvathycof@gmail.com> 

26. Rajlakshmi Mishra, University School of Environmental Management, Guru Gobind Singh Indraprastha University, New Delhi, India <rajlakshmi.jha@gmail.com> 

27. Rahul Prabhukhanolkar, Mhadei Research Center, Belagavi and Indian Bat Conservation Research Unit, India <pkrahul85@gmail.com> 

28. A. Karthikeyan, Madurai Kamaraj University, Madurai, India. <aero2.karthi@gmail.com> 

29. Prof. Hema Somanathan, Indian Institute of Science Education and Research, Thiruvananthapuram (IISER-TVM), India <hsomanathan@iisertvm.ac.in> 

30. Prof. G. Marimuthu, Madurai Kamaraj University, Madurai, India 

31. Dr. Utttam Saikia, Zoological Survey of India, Shillong, India <uttamzsi@gmail.com> 

32. Dr. H. Raghuram, PG and Research Department of Zoology, The American College, Madurai 625 002, Tamil Nadu, India <hraghuram@gmail.com> 

33. Tharaka Kusuminda, Department of Agricultural Biology, Faculty of Agriculture, University of Ruhuna, Kamburupitiya, Sri Lanka. <t.kusuminda@gmail.com> 

34. Jayanthi Kallam, Founder and Executive Director, Avian and Reptile Rehabilitation Trust, Bangalore, India <arrcindia@gmail.com> 

35. Prof. Sripathi Kandula, Madurai Kamaraj University / Chettinad Academy of Research and Education, Chennai, India <sribat@gmail.com> 

36. Dr. Amani Mannakkara, Department of Agricultural Biology, Faculty of Agriculture, University of Ruhuna, Kamburupitiya, Sri Lanka. <amani@agbio.ruh.ac.lk> 

37. Ravi Umadi, Department of Biologie II, Biocenter, Ludwig-Maximillians Universitaet, Munich, Germany <ravisumadi@gmail.com> 

38. Sargam Singh Rasaily IFS, APCCF/Member Secretary, Uttarakhand Biodiversity Board, Dehradun, Uttarakhand, India <rasaily.ifs@gmail.com> 

39. R.M.T. Priyanwada Rathnayake, Master of Environment Management , Faculty of Graduate Studies , University of Colombo, Sri Lanka <priyanwada1@gmail.com

40. Sangay Tshering, College of Natural Resources, Royal University of Bhutan, Punakha, Bhutan. <desangma06@gmail.com

41. Dr. D. Paramanantha Swami Doss, Assistant Professor, St. John’s College, Palayamkottai, Tamil Nadu, India <dossanad@gmail.com

42. Dr. Venkatesh Nagarajan Radha, Postdoc Associate, University of Sydney, Australia. <venkatesh.nagarajan.radha@gmail.com

43. Dr. Chelmala Srinivasulu, Department of Zoology, Osmania University, Hyderabad, Telangana State, India <srini.chelmala@gmail.com

44. Dr. Bhargavi Srinivasulu, Department of Zoology, Osmania University, Hyderabad, Telangana State, India 

45. Dr. S. Baskaran, Assistant Professor, Department of Biotechnology, The Madura College, Madurai, Tamil Nadu, India <baskarmku@gmail.com

46. Chamara Amarasinghe, Faculty of Graduate Studies, University of Colombo, Sri Lanka. <a.zeylanica@gmail.com

47. Pratik Das, XVI M.Sc., Wildlife Institute of India, Dehradun, India. 

48. Dr. Touseef Ahmed, Department of Biological Sciences, Texas Tech University, Texas, USA. <touseef.ahmed@ttu.edu

49. Dr. T. Karuppudurai, Madurai Kamaraj University, Madurai, India. <tkdurai@gmail.com

50. Steffi Christiane R, Department of Animal Behaviour & Physiology, School of Biological Sciences, Madurai Kamaraj University, Madurai, India. <christianesteffi16@gmail.com

51. Dr. Manjari Jain, Indian Institute of Science Education and Research, Mohali (IISER-M), India <manjari@iisermohali.ac.in

52. Suranjan Karunarathna, Nature Exploration and Education Team, Colombo, Sri Lanka <suranjan.karu@gmail.com

53. Dr. Sanjay Molur, Co-chair, Chiroptera Conservation & Information Network of South Asia (CCINSA), Zoo Outreach Organization, Coimbatore, India. <sanjay@zooreach.org

54. Dr. Kranti Yardi, Professor, Bharati Vidyapeeth Institute of Environment Education and Research, Bharati Vidyapeeth Deemed to be University, Pune <kranti@bvieer.edu.in

55. Aita Hang Subba, Guest faculty, Department of Zoology, Sikkim University, Gangtok, India <aitalimboo20@gmail.com

56. M. Mathivanan, Senior Research Associate, Ashoka Trust for Research in Ecology and the Environment (ATREE), Agasthyamalai Community Conservation Centre (ACCC), Manimutharu, Tirunelveli, Tamil Nadu, India <mathi@atree.org

57. Dr. Adora Thabah, Freelance researcher, Shillong, Meghalaya. <abatty1@gmail.com

58. Tijo K Joy, UNDP Cluster Coordinator- Conservation & Ecology HTML Project, Munnar, Kerala, India. 

59. Dr. K. Emmanuvel Rajan, Department of Animal Science, School of Life Sciences, Bharathidasan University, Tiruchirappalli-620024, Tamil Nadu, India <emmanuvel@bud.ac.in

60. Shasank Ongole, National Centre for Biological Sciences, Bengaluru, Karnataka 

61. Soham Mukherjee, Herpetologist & Wildlife Biologist, NAJA India, Ahmedabad (Gujarat), India <soham.naja@gmail.com

62. Kadambari Deshpande, Ashoka Trust for Research in Ecology and the Environment (ATREE), Bangalore, India 

63. Thejasvi Beleyur, Max Planck Institute for Ornithology, Seewiesen, Germany <thejasvib@gmail.com

64. Dr Md Nurul Islam, FETPV Technical Officer, Global Health Development (GHD), Bangladesh <nislam@globalhealthdev.org

Note: The views of the signatories are personal and may not reflect those of their institutions. 

References

1. “Bats are Bengaluru’s enemy no 1 now”, news article in Bangalore Mirror on 20th
April 2020. https://bangaloremirror.indiatimes.com/bangalore/cover-story/bats-are-
bengalurus-enemy-no-1-now/articleshow/75240633.cms

2. “Myths of bats spreadinng Coronavirus: Two trees chopped off in city”, news report
in Star of Mysore on 3rd April 2020. https://starofmysore.com/myth-of-bats-
spreading-coronavirus-two-trees-chopped-off-in-city/

3. Zhou, P., Yang, X., Wang, X. et al. (2020). A pneumonia outbreak associated with a
new coronavirus of probable bat origin. Nature 579, 270–273 (2020).
https://doi.org/10.1038/s41586-020-2012-7

4. Andersen, K.G., Rambaut, A., Lipkin, W.I. et al. (2020) The proximal origin of
SARS-CoV-2. Nat Med 26, 450–452. https://doi.org/10.1038/s41591-020-0820-9

5. Boni, M.F., Lemey, P., Jiang, X. et al. (2020). Evolutionary origins of the SARS-
CoV-2 sarbecovirus lineage responsible for the COVID-19 pandemic. Preprint on
www.biorxiv.org. https://doi.org/10.1101/2020.03.30.015008

6. World Health Organization Fact Sheet on Ebola: https://www.who.int/news-
room/fact-sheets/detail/ebola-virus-disease

7. World Health Organization Fact Sheet on Nipah virus: https://www.who.int/news-
room/fact-sheets/detail/nipah-virus

8. World Health Organization Fact Sheet on Middle Eastern Respiratory Syndrome:
https://www.who.int/news-room/fact-sheets/detail/middle-east-respiratory-syndrome-
coronavirus-(mers-cov)

9. Yadav, P.D, Shete-Aich, A., Nyayanit, D.A., et al. (2020). Detection of coronaviruses
in Pteropus and Rousettus species of bats from different states of India. Indian
Journal of Medical Research

10. Dhillon, J., Banerjee, A. (2015) Controlling Nipah virus encephalitis in Bangladesh:
Policy options. J Public Health Pol 36, 270–282.
https://doi.org/10.1057/jphp.2015.13

11. Jones, B.A, Grace, D., Kock, R. et al. (2013). Zoonosis emergence linked to
agricultural intensification and environmental change. PNAS 110 (21), 8399-8404.
https://doi.org/10.1073/pnas.1208059110

12. Aziz, SA, Clements, GR, McConkey, KR, et al. (2017) Pollination by the locally
endangered island flying fox (Pteropus hypomelanus) enhances fruit production of the
economically important durian (Durio zibethinus). Ecol Evol.; 7: 8670– 8684.
https://doi.org/10.1002/ece3.3213

13. Trejo-Salazar, R.E, Eguiarte, L.E, Suro-Piñera, D. and Medellin, R.A. (2016) Save
Our Bats, Save Our Tequila: Industry and Science Join Forces to Help Bats and
Agaves Natural Areas Journal 36(4), 523-530. https://doi.org/10.3375/043.036.0417

14. Nathan, P.T., Karupuddurai, T., Raghuram, H. and Marimuthu, G. (2009). Bat
foraging strategies and pollination of Madhuca longifolia (Sapotaceae) in southern
India. Acta Chiropterologica, 11(2): 435-441.

15. Acharya, P.R. (2015). Chepang Chiuri and Chamera. Friends of Nature, Kathmandu.

16. Wanger, T.C., Darras, K., Bumrungsri, S. et al. (2014). Bat pest control contributes to food security in Thailand. Biological Conservation, 171: 220-223.

17. Maas, B., Clough, Y. and Tscharntke, T. (2013). Bats and birds increase crop yield in
tropical agroforestry landscapes. Ecology Letters, 16: 1480-1487.

18. Maine, J. and Boyles, J.G. (2015). Bats initiate vital agroecological interactions in
corn. PNAS, 112(4): 12438-12443.

19. Srinivasulu, C., Srinivasulu, A. and Srinivasulu. B. (2020). Checklist of the bats of
South Asia (v1.1). https://threatenedtaxa.org/index.php/JoTT/checklists/bats/southasia
[Date of publication: 13 April 2020].

20. Jnawali, S.R., Baral, H.S., Acharya, K.P., Upadhyay, G.P. et al. (2011). The Status of
Nepal Mammals: The National Red List Series, Department of National Parks and
Wildlife Conservation, Kathmandu, Nepal.


Also read: Bat coronavirus found in two Indian species of bats for the first time: ICMR study


AUSTIN BATS and COVID-19:

•             Bats in Austin do not have or spread SARS-CoV-2 (the virus that causes COVID-19 in humans). SARSCoV-2 is not found in North American bat species at present.

•             Transmission of COVID-19 is from humans to other humans.

•             There are theoretical concerns about the possibility for transmission of SARS-CoV-2 from humans to bats. Research is underway; until we know more, precautions to minimize the chance of North American bats of being exposed to SARS-CoV-2 are being taken. This is not unique to bats – there are also concerns of possible transmission from humans to other wildlife species, particularly mustelids, felids and canids.

•             Avoid handling live bats and any wildlife. If handling live bats cannot be avoided, follow recommendations about PPE to prevent spread of respiratory droplets – a face mask, thick gloves, etc.

  •              The concern is transmission of SARS-CoV-2 from humans to bats, not vice versa, so handling dead bats is fine. Dead bats provide valuable information to bat biologists. To collect a dead bat, wear gloves, wrap in paper towel, and double bag in a Ziploc. Place on ice or in freezer until the bat can be retrieved. Avoid any skin contact to prevent rabies exposure and keep pets and children away.

Bat conservation and COVID-19

•             Many bat species have adapted to urban and rural environments, where they coexist safely with people. Ask us about living with bats safely.

•             It is important that bats and bat habitat not be destroyed because of unfounded fears over coronavirus transmission.

•             Bats in North America are in trouble from habitat loss and white-nose syndrome – at least two species in Texas have experienced sharp decline just this spring.

•             Bats are essential to our Texas ecosystems and economy. Nationwide, bats are estimated to provide $23 billion of natural pest control each year.

•             Killing bats would not have any effect on the spread of COVID-19, but would negatively affect bat populations, conservation efforts, and our economy.

Austin Bat Refuge would like to remind people we are here to answer your questions and collect reports on bat sightings, bat roosts, and dead bats.  Contact us at info@austinbatrefuge.org and 512-695-4116 or 512-799-8847.

(This post borrowed and modified from BC Community Bat Program)


April 17, 2020
By Dr Tigga Kingston

Bats have earned an unwarranted reputation as disease spreaders since the Covid-19 outbreak. With April 17 marking world Bat Appreciation Day, Dr Tigga Kingston sets out to provide the full picture on the misunderstood mammals

It’s 7.20pm at the edge of the rainforest of Krau Wildlife Reserve in Peninsular Malaysia. Plaintive calls of nightjars herald the transition from day to night as silhouettes of bats flitter in the twilight. It is time to head into the forest. 

There are five of us tonight; I’m joined by my two PhD students Juliana Senawi (Julie) and Nurul Ain Elias (Ain) and two assistants, Rahman and Amri, from the nearby Jah Hut indigenous village. 

During the day Rahman and Amri have spaced out ten harp traps along the network of forest trails. Harp traps, made up of metal rectangular frames about the size of a vertical window with fishing line stretched across, are set on legs across forest trails. 

Bats that forage for insects inside the forest understory often follow trails for part of their journey, and although they have very sophisticated echolocation to find their way around and hunt insects, they have trouble detecting the fine fishing lines. They hit the lines and slide down into a long collecting bag where they can roost and rest before we come and get them. 

While bats have earned an unwarranted reputation as spreaders of disease, particularly as a result of the Covid-19 outbreak, we have been studying these forest specialists for over two decades and how human activity is impacting their habitats.

Our research shows that because so many are adapted to forest life and the stable resources it provides, they are unable to adjust to landscapes dominated by agriculture and non-timber plantations like rubber and oil palm. We aren’t the only ones to find this, forest-dwelling bats across Southeast Asia are being lost as humans change the landscape. 

Waiting for pick up! Bats in the collecting bag of a harp trap set across a forest trail. You can see three of the four banks of fishing line and the bats hanging from the banks or side of the bag. Photo: Tigga Kingston CC BY-NC-SA 4.0
The trefoil horsehoe bat in flight. A solitary species, they usually hunt from a perch above a small clearing in the forest understory, flying out to catch passing insects before returning to their perch to eat it. Photo: Charles M. Francis CC BY-NC-SA 4.0
Wrinkled-lipped bats stream out of Deer Cave in Gunung Mulu National Park, Sarawak. It takes nearly an hour for the 3 million bats to leave and they will eat tonnes of crop pests each night. Photo: Tigga Kingston CC BY-NC-SA 4.0

The problem on everyone’s mind right now is of course Covid-19. Bats do not spread Covid-19, you can only catch it from other people. So why all the talk about bats? 

The first trap starts us off well. It has two of my favourites – the trefoil horseshoe bat and clear-winged woolly bat. The trefoil horseshoe bat is a very handsome fellow – bats of this species roost on their own under palm or rattan leaves and have tan-coloured wings, long fluffy grey fur, yellow ears, elbows and knees and wonderful yellow noseleaf. 

Horseshoe bats blast out their echolocation calls through their nostrils and use their noseleaf, a structure around their nose, to help focus the sound beam as they search for insects. 

Julie carefully gets the bat out of the trap. He will be a good candidate for the obstacle course she has devised to see how well different bat species fly through the dense forest of the understory. This helps us understand how different species will respond to changes in forest structure that result in fragmentation and timber extraction. 

When Ain goes to get the woolly bat there is a surprise in store – it’s not one bat but three clustered together to make a fluffy ball with the odd foot and wing sticking out! We’ve seen this before – the species lives in small social groups and roosts in clusters of dead leaves or old hanging bird nests.  

In the middle of the ball of fluff, noses, feet and wings is a pup, firmly attached to the mother’s nipple. Ain is thrilled, mothers need a lot of energy to produce milk for their pups, so it’s important that they give birth when there are many insects around. We are worried that climate change may alter patterns in insect availability, depriving mothers of food when they need it most, and reducing breeding success. 

By the time we have finished checking all 10 traps we have captured 30 bats of 15 species. All told, the rainforest of Krau Wildlife Reserve is home to the highest known diversity of bats in the Old World with at least 72 species. About 60 of the species are strictly insect-eating, and many of them are forest specialists. 

The problem on everyone’s mind right now is of course Covid-19. Bats do not spread Covid-19, you can only catch it from other people. So why all the talk about bats? 

SARS-CoV-2 is the virus that causes the disease Covid-19 in people. A virus related to SARS-CoV-2, called RatG2013, was isolated from an intermediate horseshoe bat from China in 2013, and that led to suggestions that perhaps the bat virus jumped from bats to people. 

There has been a flurry of research since, and now we know this is extremely unlikely for a couple of reasons. 

First, the key part of the virus that enables it to infect people is not from bats. The closest match identified so far is from a pangolin, but other wildlife may be involved. Second, although the human virus (SARS-CoV-2) and bat virus (RatG2013) are very closely related, recent work suggests they separated from one another 40-70 years ago. This means that it is not possible for the human virus to have come directly from the virus circulating in the intermediate horseshoe bats in 2013, other hosts must be involved.  

A great diversity of viruses can be found in all wildlife, but spillovers – in which the virus jumps from animals to humans – have historically been rare because many conditions must align for spillover to be possible. 

What is becoming very clear is that human activities are making these conditions possible more often. Habitat disturbance and destruction stress animals making them susceptible to viruses and more likely to produce high numbers of viruses.

Humans are encroaching on wildlife habitat or trading, butchering and consuming wildlife, all of which increases human exposure. Humans bring species together in markets and farmlands increasing opportunities for cross-species transmission that is often a key step towards human infection. 

As a result of these human activities, we are seeing more spillover events, sometimes with deadly pandemic consequences. The solutions are simple and familiar – we must protect and restore habitats, stop exploitation of wildlife, and keep the worlds’ wildlife and ecosystems healthy. 

This portrait of a wrinkle-lipped bat makes it clear how they get their name. We aren’t sure why he’s such a lovely foxy red colour, but its common in older cave-dwelling bats. Photo: Tigga Kingston CC BY-NC-SA 4.0

As mentioned, loss of habitat is just one challenge facing Southeast Asia’s bats. About half the region’s bats roost in caves, but these are not the peaceful refuges they once were. Tourism, harvesting of guano and cave swiftlet nests, people just hanging out– all can disturb bats at roosts.  

Many of the cave systems in Southeast Asia are made up of limestone and quarried by the cement industry resulting in total loss of cave roosts. Intense hunting of some species, particularly the large fruit bats, or “flying foxes”, for consumption or a perceived medicinal use is pushing many species to the brink of extinction. 

Demand for large fruit bats is so great in Indonesia’s North Sulawesi that populations have been wiped out in the north and bats are being hunted and shipped from other provinces of Sulawesi and nearby islands to meet demand– as many as 500 tonnes per year. Fifty years ago, similar hunting levels on the Pacific island of Guam drove the island’s flying fox species, found nowhere else in the world, to extinction and decimated populations of another nine species from nearby islands.  

The reason that hunting has such a big impact is because bats are very like us in many ways. They are long-lived mammals, particularly for their size, with some species living more than 30 years. Most species only give birth to one pup a year, and large species like the flying foxes typically don’t start to breed until their second or even third year. This means that populations are very slow to recover losses and can’t withstand sustained disturbance or intense hunting. 

Land-use change, widespread hunting and destruction of roosts threaten 24% of Southeast Asia’s species but the conservation status and population trends for many species are unknown. This is tragic because Southeast Asia is such an extraordinary region for bats – a bat diversity hotspot home to over 400 species. That’s about 28% of all the world’s 1400 bat species in just 11 countries! 

For a long time, very little was known about the region’s bat diversity, with just a handful of dedicated researchers active, but over the last 10-15 years more researchers are training in bats and have come together to form a multinational network – the Southeast Asian Bat Conservation Research Unit (SEABCRU) – to exchange information and work together across borders. 

There have been lots of exciting discoveries as a result, including the description of 40 species new to science in just the last 12 years – a rate of discovery that suggests that there are lots more species still to describe. How tragic it would be to lose species because of habitat loss before we have even found and described them. 


Researchers in the SEABCRU have shown just how important bats are for humans, particularly for ecosystem health and human food security. Bats are important pollinators and seed dispersers of hundreds of ecologically and economically important plants. Most famously they are the key pollinator of the King of Fruits itself, durian. Durian is an $18 billion dollar industry, but no bats means no durian!  

Bats are the only mammals that can truly fly rather than glide. Their scientific name – Chiroptera – means “handwing”. In this beautiful Egyptian fruit bat you can see how the wing is made of a thin layer of skin is stretched out over the elongated fingers bones of the “hand”.  Photo:Sherri and Brock Fenton CC BY-NC-SA 4.0

Dr Sara Bumrungsi and his students at Prince of Songkla University in Thailand have calculated that in southern Thailand alone, the services of just one species, the dawn cave bat, in pollinating durian and petai (another regional favourite) is worth around USD $12 million a year.

As their name suggests, cave dawn bats roost in colonies of thousands to tens of thousands in caves, but there are disturbing reports that numbers across Southeast Asia are declining as caves are lost to disturbance and limestone extraction, and populations hunted. 

The wrinkle-lipped free-tailed bat is another colonial species that roosts in caves in the thousands and even millions. Each night, thousands of bats stream out of their caves and zoom out across the landscape, travelling tens of kilometres on some nights in pursuit of insects. Among their favorite foods are plant-hoppers – one of the biggest pests of rice crops in Southeast Asia. 

One colony in Thailand of 2.6 million bats eats about four tonnes of these pests in a single night, and across Thailand this one species saves the country about 2892 tonnes of rice annually – that’s 26,000 rice meals!  Of course, everything that bats are doing that benefits us, they also do in the forests and natural landscapes of the region, ensuring that bat-dependent trees are pollinated, seeds are dispersed, and insect populations suppressed. 


It’s 11pm and Julie, Ain and I have just finished processing our 30 bats. Each bat was identified to species, sexed, and the length of its forearm and body mass recorded. We put numbered bands on their forearms so we can recognise individuals if we catch them again in coming years and learn how long they live, and how they move around the forest. 

Ain found that most of the females were either pregnant or lactating – we are in the breeding season. The trefoil horseshoe bat did a so-so job on Julie’s flight obstacle course (a series of vertical strings), but the woolly bats skipped through as though there was nothing there. We take each bat back to the trap it was caught in for release. 

This is one of the best parts of the night, so we share the bats out evenly, although, as the boss, I always get the trefoil horseshoe bats. I gently put my hand at the edge of the trefoil’s bag and open it up. After a bit of scrabbling, his feet latch onto my finger and I draw him out.

He hangs from my finger and scans the area with echolocation calls too high for us to hear. He’s not blind but lives in a world made of echoes. Satisfied, he silently launches from my finger and flies into the night. 


Viral zoonotic risk is homogenous among taxonomic orders of mammalian and avian reservoir hosts

by Nardus Mollentze

View ORCID ProfileNardus Mollentze and View ORCID ProfileDaniel G. Streicker PNAS first published April 13, 2020 https://doi.org/10.1073/pnas.1919176117

  1. Edited by Nils Chr. Stenseth, University of Oslo, Oslo, Norway, and approved March 9, 2020 (received for review November 6, 2019)

Significance

Identifying whether novel human viruses disproportionately originate from certain animal groups could inform risk-based allocations of research and surveillance effort. Whether such “special reservoirs” exist remains controversial. We show that the proportion of viruses that infect humans varies minimally across reservoir taxonomic orders. Instead, the number of human-infecting viruses increases proportionately to the total number of viruses maintained by each reservoir group, which is in turn explained by the number of animal species within each group. This supports a host-neutral explanation for observed variation in the number of zoonoses among animal groups, such that traits of animal orders are unlikely to produce viruses that disproportionately threaten humans. These findings refine strategies to identify high-risk viruses prior to their emergence.

Abstract

The notion that certain animal groups disproportionately maintain and transmit viruses to humans due to broad-scale differences in ecology, life history, and physiology currently influences global health surveillance and research in disease ecology, virology, and immunology. To directly test whether such “special reservoirs” of zoonoses exist, we used literature searches to construct the largest existing dataset of virus–reservoir relationships, consisting of the avian and mammalian reservoir hosts of 415 RNA and DNA viruses along with their histories of human infection. Reservoir host effects on the propensity of viruses to have been reported as infecting humans were rare and when present were restricted to one or two viral families. The data instead support a largely host-neutral explanation for the distribution of human-infecting viruses across the animal orders studied. After controlling for higher baseline viral richness in mammals versus birds, the observed number of zoonoses per animal order increased as a function of their species richness. Animal orders of established importance as zoonotic reservoirs including bats and rodents were unexceptional, maintaining numbers of zoonoses that closely matched expectations for mammalian groups of their size. Our findings show that variation in the frequency of zoonoses among animal orders can be explained without invoking special ecological or immunological relationships between hosts and viruses, pointing to a need to reconsider current approaches aimed at finding and predicting novel zoonoses.

Most emerging infectious diseases of humans are viruses that originate from nonhuman animals via “zoonotic” transmission (13). Given the diversity of animals and viruses in nature, targeting virus discovery, surveillance, and research toward the taxonomic groups with the highest propensity to infect humans would benefit attempts to mitigate future disease outbreaks (47). Identifying these groups remains a major challenge. Viruses with RNA genomes are overrepresented as zoonoses and certain families including Filoviridae, Orthomyxoviridae, and Togaviridae contain a large proportion of zoonotic species (8, 9). Among hosts, however, patterns are less clear. Large-scale comparative studies have suggested that barriers to cross-species transmission increase with evolutionary divergence from humans, implying heightened zoonotic risk from closely related nonhuman primates (9, 10). Yet, other animal groups including bats, rodents, and ungulates are also frequently associated with zoonoses despite their evolutionary distance from humans (9, 1113). A popular explanation (here, the “special reservoir hypothesis”) is that physiological or ecological traits of these taxa make them more likely to maintain zoonotic viruses or transmit them to humans. For example, ungulates and rodents include domesticated or anthropophilic species whose high ecological overlap with humans could facilitate pathogen exchange (13, 14). In contrast, the unique life history of bats has been hypothesized to create an evolutionarily distinct immunological environment that selects for viral traits that favor human infection (1520). An alternative to the special reservoir hypothesis is that host species maintain a similar number of viruses with a similar per-virus risk of zoonotic transmission. Variation in the number of zoonoses among animal groups therefore arises as a consequence of their species richness (here, the “reservoir richness hypothesis”). For example, the preponderance of rodent- or bat-associated zoonoses could reflect the large number of rodent and bat species relative to other mammalian groups (21). These hypotheses imply different management strategies. The special reservoir hypothesis would advocate fundamental research to define the ecological or physiological trait profiles that explain the propensity of certain hosts to harbor zoonoses, followed by targeted surveillance or virus discovery in hosts with high-risk trait profiles. In contrast, the reservoir richness hypothesis would advocate broader surveillance and virus discovery, possibly proportionate to the local species richness of different animal groups, and would imply the need for deeper understanding of which features of virus biology enhance zoonotic transmission.

Identifying patterns in the animal origins of zoonoses has been frustrated by disconnects between the key outcome of interest, the likelihood of zoonotic transmission, and currently available data which document viral infection in human and nonhuman hosts but provide limited information on the origins of these infections. For example, humans may infect nonhuman hosts, rather than the other way around, but only the latter direction of transmission is pertinent to zoonotic origins. A greater challenge is that the reservoir host species that maintain and transmit viruses to humans can rarely be distinguished from species that form a larger community of “dead-end” hosts that are inconsequential to transmission (22, 23). Rather than reflecting genuine imbalances in the animal origins of human infections, associations between certain animal groups and zoonotic viruses based on shared detections might instead emerge from heightened surveillance for or susceptibility to zoonotic viruses in these groups even if they are not key components of natural transmission cycles. As the known diversity of viruses expands, the increasing difficulty of differentiating related viruses in different host species from the same virus transmitted between these host species would exacerbate this effect by overestimating viral sharing, particularly if relying on serological or PCR data alone (24).

Given this uncertainty in the reservoir hosts of most viruses at the species level, an alternative approach to resolving whether animal host associations influence zoonotic risk would be to assess reservoir associations at lower taxonomic resolutions. Such analyses would take advantage of the tendency for viruses to be maintained by host species within the same taxonomic order, a phenomenon which arises from more frequent host shifting among closely related species and the cospeciation of hosts and viruses (2527). At this coarser taxonomic level, transmission cycles may be accurately defined for hundreds of viruses, enabling a test of host effects predicted by the special reservoir hypothesis (e.g., applying to animal orders such as Chiroptera or Rodentia) that is robust to reservoir species uncertainty. Further, condensing reservoir–virus associations to a single observation per virus would enable statistical approaches that separate confounding effects of virus and host taxonomy that arise from the nonrandom distribution of virus families with differing zoonotic propensity among reservoir groups. These models could also account for additional factors including differential research effort among host and virus groups and the phylogenetic proximity of animal hosts to humans that are suspected to vary with zoonotic transmission (9, 28).

Results

We used literature searches to expand an existing dataset of the maintenance cycles of single-stranded RNA viruses (27) to include all 35 RNA and DNA virus families infecting birds and mammals, the hosts that account for the vast majority of zoonoses (8). From a total of 673 virus species, 415 species from 30 families had compelling evidence for transmission by one or more of the 11 taxonomic orders of nonhuman reservoirs (three avian, eight mammalian) which met our inclusion criteria (Materials and Methods). When possible, viral species linked to more than one reservoir group were subdivided into reservoir order-associated viral clades (n = 11 species), and otherwise excluded (n = 2), creating a final dataset of 429 reservoir–virus associations. Data on zoonotic status (i.e., whether a virus had been reported to transmit from nonhumans to humans) were obtained from Olival et al. (9), Woolhouse and Brierley (29), and primary literature searches. We found dramatic variation in the number and diversity of viruses across reservoir groups (Fig. 1). Cetartiodactyls and rodents were the most common reservoirs in our dataset, together accounting for half of the included viruses (50.6%), while anseriforms (waterfowl) were the most poorly represented, with only 1.4% of viruses (Fig. 1A). We quantified the degree of skew in viral diversity among groups of reservoirs using a sliding metric which places varying amounts of emphasis on rare viral lineages (30), here defined as those virus taxonomic lineages that were rarely found in the focal reservoir order. Despite harboring substantial viral species richness, the taxonomic distribution of viruses was notably skewed for some host groups (Fig. 1B). The majority of primate and rodent viruses fell in two to three viral families and the remaining viruses were scattered across families that contained few other species infecting these host groups (on average, two species; Fig. 1 A and B). Other groups including carnivores and odd-toed ungulates had smaller, but more balanced, viral communities (Fig. 1B). Both the number and the proportion of zoonotic virus species appeared to differ among reservoir groups, although the 95% CI of proportions overlapped in most cases (Fig. 1C). The taxonomic distribution of zoonoses within host groups was highly skewed (Fig. 1A). For example, 50% of zoonotic bat viruses were rhabdoviruses and 53.7% of zoonotic rodent viruses were hantaviruses or arenaviruses, reinforcing the need to account for virus taxonomy to avoid detecting effects of reservoirs on zoonotic status that would be unlikely to generalize across bat or rodent viruses (SI Appendix, Fig. S1).

Fig. 1. Species richness and diversity of viruses associated with major reservoir host groups. (A) The distribution of virus families across mammalian and avian reservoir orders. Each rectangle represents a reservoir–virus family combination, with size corresponding to the number of virus species linked to that reservoir and color indicating the proportion of these viruses which are zoonotic. Viral families are abbreviated as follows: Ade = Adenoviridae, Are = Arenaviridae, Art = Arteriviridae, Asf = Asfarviridae, Ast = Astroviridae, Cal = Caliciviridae, Cir = Circoviridae, Cor = Coronaviridae, Fil = Filoviridae, Fla = Flaviviridae, Hepa = Hepadnaviridae, Hepe = Hepeviridae, Her = Herpesviridae, Nai = Nairoviridae, Ort = Orthomyxoviridae, Pap = Papillomaviridae, Para = Paramyxoviridae, Parv = Parvoviridae, Per = Peribunyaviridae, Phe = Phenuiviridae, Pic = Picornaviridae, Pne = Pneumoviridae, Pol = Polyomaviridae, Pox = Poxviridae, Reo = Reoviridae, Ret = Retroviridae, Rha = Rhabdoviridae, Tob = Tobaniviridae, and Tog = Togaviridae. (B) The taxonomic diversity of viruses maintained by each reservoir, at decreasing levels of sensitivity to rare lineages as the q-parameter increases. (C) The number and proportion of virus species associated with each reservoir which are zoonotic; error bars show 95% binomial CIs calculated using the Wilson method

We next used generalized additive mixed models with zoonotic status as a binary response variable to identify and rank the host and/or viral traits that influenced the zoonotic status of viruses. When ranking models using the Akaike information criterion (AIC), the top model explained a total of 52.3% of deviance in zoonotic status (Fig. 2A). This model contained several previously reported effects of viral biology, including transmission by arthropod vectors and exclusively cytoplasm-based replication, which increased the odds of being zoonotic 4.1-fold (log odds = 1.40) and 15.7-fold (log odds = 2.75), respectively (Fig. 2C). However, neither explained >2.2% of the deviance (Fig. 2A). Zoonotic viruses also tended to be more studied, with the number of publications associated with each virus species explaining 15.2% of the deviance (Fig. 2B).

Fig. 2. Reservoir host and virus predictors of zoonotic propensity. (A) Top 15 models ranked by AIC, along with the top models not containing a virus-family specific effect (ranked 23rd to 28th), and the top models not containing an effect for virus publication count (ranked 177th to 182nd). Rows represent individual models and columns represent variables. Cells are shaded according to the proportion of deviance explained by each effect; effects not present in particular models are indicated in white. The final three columns represent different versions of a potential “special reservoir effect” and were not allowed to cooccur in the same model. (BF) Effects present in the top model. Lines indicate the predicted effect of each variable, when keeping all other variables at either their median observed value (when numeric) or their most common value (when categorical). Shaded regions indicate the 95% CIs of predictions, while points indicate partial residuals after accounting for all variables in the model except the one on the x axis. Effects whose 95% CI cross zero over the entire range of the predictor variable are shaded in gray. Phylogenetic distance (E) was measured as cophenetic distances, which describe the total evolutionary distance from each group to primates. Note that only the subset of virus families which include significant effects (i.e., those showing no overlap with 0) are illustrated in F (see SI Appendix, Fig. S2 for all families).

Among effects related to reservoir hosts, zoonotic risk declined with greater phylogenetic distance from reservoirs to primates, but this effect explained only 0.7% of the deviance in the top model and was absent from other competitive models (Fig. 2 A and E). Effects of reservoir order or phylogeny (either alone or crossed with an effect of virus family-level taxonomy) did not occur until the 23rd-ranked model, where they explained <0.01% of the deviance (ΔAIC from top model >16.9; Fig. 2A). The only strongly supported models containing an effect of reservoir host restrained the effect to certain viral families (i.e., a random effect of reservoir nested within virus family, here termed the “virus family-specific reservoir” effect). This effect explained 20.7% of the deviance in zoonotic status in the top model. In particular, primate adenoviruses and retroviruses, bat rhabdoviruses, and rodent picornaviruses were more likely to be zoonotic relative to viruses from the same families associated with other reservoirs (Fig. 2F). Critically however, none of these reservoir groups increased zoonotic propensity across additional viral families, suggesting the absence of generalizable effects of reservoir group on the likelihood of zoonotic transmission (Fig. 2A and SI Appendix, Fig. S2).

We further evaluated whether effects of reservoir hosts on zoonotic status might have been missed due to the inclusion of potentially collinear variables or insufficient statistical power to fit complex models. First, given that study effort understandably increased for zoonotic viruses, including this factor might have disguised true reservoir effects. However, models which did not adjust for virus-related publication counts failed to support reservoir effects; the best of such models achieved similar AIC values with and without reservoir effects (models 177 to 182, Fig. 2A). Second, including virus taxonomy might have reduced the power of our models. However, reservoir effects remained negligible or absent in models which excluded viral taxonomy (SI Appendix, Fig. S3). In contrast, viral family effects were robust to inclusion of general reservoir effects (i.e., those testing for consistent reservoir effects across viral families). When the family-specific reservoir effect was not present, viral rather than reservoir taxonomy was the stronger predictor of zoonotic status (models 23 to 28 in Fig. 2A and SI Appendix, Fig. S3). Thus, our results provide no support for the special reservoir hypothesis, which predicted that viruses associated with certain reservoir groups would be more likely to be zoonotic.

Instead, both the total number of viruses associated with each reservoir group (“viral richness”) and the number of zoonoses matched expectations under the reservoir richness hypothesis. The absence of reservoir effects meant that viral richness was strongly correlated with the number of zoonotic species (R2 = 0.88, P < 0.001; Fig. 3), consistent with a similar per-virus zoonotic risk across reservoirs. Notably, a similar correlation was previously observed when measuring viral richness at the host species level (9). A series of negative-binomial generalized linear models showed that—after controlling for greater viral richness in mammals compared to birds—reservoir species richness was correlated with both the number of zoonotic viruses (65.5% of deviance) and the viral richness (56.4% of deviance) of different reservoir orders (Fig. 4 and SI Appendix, Fig. S4). These models outcompeted those including previously identified effects of virus-related research effort and the phylogenetic distance of each reservoir group from primates (9), which when included explained a maximum of 3.1% additional deviance (ΔAIC ≥ 1.09; models 2 to 4 in Fig. 4A). Exchanging the reservoir class effect (i.e., birds versus mammals) for phylogenetic distance to primates performed considerably worse than the top model (ΔAIC = 4.72; model 5 in Fig. 4A). Similar results were observed for models predicting total viral richness (SI Appendix, Fig. S4).

Fig. 3. Relationship between the number of virus species and the number of zoonotic species maintained by each reservoir group. The line shows a linear regression fit, with its 95% CI indicated by the shading.
Fig. 4. Factors predicting the number of zoonotic virus species across animal orders. (A) Models for all possible variable combinations ranked by AIC. Each row represents a model, while columns represent variables. Filled cells and white cells indicate variable inclusion and absence, respectively. The top four model are color-coded, with colors reused in all other panels to identify the respective models. (B) Coefficient estimates for the top four models; points indicate the maximum likelihood estimate and lines show 95% CIs. All variables were scaled by dividing them by 2 times their SD, meaning coefficients are directly comparable as effect sizes. (C and D) Partial effect plots for variables in the top model. Lines and shading indicate the partial effects and 95% CIs, with points showing partial residuals. (E) Predicted number of zoonotic viruses for each reservoir group when using the top model (blue in A; see SI Appendix, Fig. S5 for other top models).

We next assessed how well the predictions of the reservoir richness model matched observations in individual reservoir groups. Highly recognized mammalian reservoir groups including bats and rodents hosted close to the number of zoonoses expected from their species richness (bats: 22 observed and 28 predicted [95% CI: 10.7 to 45.7]; rodents: 41 observed and 42 predicted [95% CI: 10.2 to 72.9]; Fig. 4E). In contrast, lagomorphs (rabbits, hares, and pikas) and diprotodonts (an order of marsupials) hosted both fewer viruses and fewer zoonoses than predicted; however, these were among the least-studied animal groups (Fig. 4E and SI Appendix, Fig. S4E). The only potentially “special” reservoirs identified by this analysis were the cetartiodactyls (even-toed ungulates and whales) and primates, which hosted more zoonoses than would be predicted for mammalian groups with their species richness (Fig. 4E). In the case of primates, this likely reflects the higher zoonotic propensity of primate-borne adeno- and retroviruses identified above (24 zoonotic viruses observed, of which 3 are adenoviruses and 7 are retroviruses; 15 predicted [95% CI: 7.8 to 22.4]). The mismatch was greater for cetartiodactyls (28 observed, 12 predicted [95% CI: 6.1 to 17.3]). However, perhaps due to their close association with humans as domestic livestock, this group also had considerably higher total viral richness than predicted (112 observed and 45 predicted [95% CI: 25.3 to 65.5]; SI Appendix, Fig. S4E). Consequently, the proportion of cetartiodactyl viruses which were zoonotic was unexceptional, inconsistent with the special reservoir hypothesis (Figs. 1 and 3). Strikingly, although mammals had elevated viral and zoonosis richness compared to birds, the proportion of zoonotic viruses was similar between classes, with 9/30 of avian and 115/387 of mammalian virus species being zoonotic (30% and 28.8%, respectively), emphasizing that—regardless of the cause—it is the underlying number of virus species which differs between mammals and birds, not the zoonotic component.

Discussion

Animal groups have been proposed to differ in their propensity to transmit viruses to humans as a consequence of variation in their life history, physiology, or ecology. By combining a large dataset of reservoir host–virus associations with records describing their histories of human infection, our analysis found no evidence that the taxonomic identity of reservoirs affects the probability that the viruses they harbor are zoonotic. Instead, variation in the number of zoonoses maintained by each reservoir group was consistent with a largely host-neutral model, whereby more species-rich reservoir groups host more virus species and therefore a larger number of zoonotic species. These findings imply the need to reconsider some current approaches to virus discovery, surveillance, and research.

The absence of effects of reservoir host associations on the zoonotic status of viruses is at odds with the idea that conserved traits of certain host groups alter the zoonotic potential of their viruses. If host traits predictably altered zoonotic risk, these effects would be expected to act on multiple viral groups. Instead, we found that reservoir effects were isolated within individual virus families, such that no reservoir group altered the zoonotic risk of viruses across a broad range of viral families. For example, bats are widely considered special reservoirs due to their association with several high-profile zoonoses, including Severe acute respiratory syndrome-related coronavirus (Coronaviridae), Nipah henipavirus (Paramyxoviridae), and Ebola viruses (Filoviridae) (17, 19, 31). However, virus species within those families with a bat reservoir were no more likely to be zoonotic than those transmitted by other hosts, although we acknowledge that this effect would have been difficult to detect for filoviruses given the small number of virus species in this family. While our results do not dispute the existence of distinct features of bat immunity or life history which have been hypothesized to influence viral communities in bats (16, 18, 19, 32, 33), they provide no compelling evidence that these traits translate into an increased probability of bat-associated viruses infecting humans.

Idiosyncratic family-specific reservoir effects could reflect especially zoonotic clades within viral families that are strongly host-associated, sampling biases, or genuine interactions between the biological features of specific viral groups and specific reservoirs that increase zoonotic capability (e.g., differences in viral shedding or tissue tropism). Among rhabdoviruses, a significantly elevated proportion of bat-associated species were zoonotic, but this effect was driven by the rabies-causing genus Lyssavirus, which contained 73% of the 25 zoonotic rhabdovirus species and is strongly bat-associated (35). However, Rabies lyssavirus is also zoonotic when associated with carnivores and bat-associated Rhabdoviruses outside of the Lyssaviruses are not known to be zoonotic, suggesting that traits of this viral genus rather than its reservoirs are the underlying driver of the detected bat effect (SI Appendix, Fig. S3). The putatively heightened frequency of zoonotic rodent-associated picornaviruses might conceivably arise if transmission by rodents selects for viral traits that disproportionately promote zoonotic capability or if picornaviruses have similar zoonotic capability across reservoir groups but heightened ecological overlap favors zoonotic transmission from rodents. Yet, given that our dataset contained only three rodent-associated picornaviruses (all zoonotic) and primates and cetartiodactyls also hosted zoonotic picornaviruses (three out of four and one out of six zoonotic, respectively), a statistical artifact of low sample size cannot be ruled out. In contrast, effects of nonhuman primate reservoirs on the zoonotic potential of adenoviruses and retroviruses may have a biological basis. All primate-associated adenoviruses (three out of three) and 7 out of 12 primate-associated retroviruses were zoonotic, while none of the 15 adenoviruses and 16 retroviruses associated with other reservoirs have been reported to infect humans. This suggests that evolutionarily conserved similarities between nonhuman primates and humans may facilitate zoonotic transmission in these viral families. Yet, our results also highlight limitations of host phylogeny as a generalizable predictor of zoonotic capability since primate associations did not affect the zoonotic status in most of the viral families maintained by nonhuman primates. We hypothesize that the advantages conferred by phylogenetic relatedness are crucial for viral families that are inherently host-restricted (e.g., retroviruses, which must integrate into host genomes) but are less influential for viruses with less specialized infection and replication mechanisms. More generally, the relatively poor performance of phylogenetic distance in predicting either the proportion or the number of zoonoses from different reservoir groups (Figs. 2E and 4 A and B) suggests that the evolutionarily conserved factors that facilitate cross-species transmission within animal orders (25, 36, 37) are unlikely to extend over deeper evolutionary distances.

Our modeling framework allowed us to distinguish the relative contribution of host and virus features to zoonotic status. Consistent effects of viral taxonomy support the conclusion that zoonotic ability is a feature of viral clades rather than host associations (9, 28); however, the underlying viral trait determinants remain unresolved. As shown here (Fig. 2) and elsewhere, transmission by arthropod vectors and replication in the cytoplasm of host cells were linked to zoonotic transmission (9, 38). These findings are potentially explainable by selection for viral generalism arising from the need to replicate in both vertebrate and invertebrate hosts and the avoidance of the additional barriers associated with entering and replicating in the nucleus in novel host species, respectively. Yet, the site of viral replication within cells is invariant within viral families and arthropod-borne transmission is also strongly evolutionarily conserved (27, 39). Therefore, these traits have limited utility for explaining large variation in zoonotic risk within viral families. Identifying whether factors beyond ecological opportunity predict zoonotic status is vitally important to anticipate zoonotic transmission and to estimate the number of viruses which may emerge in the future.

The number of zoonoses scaled positively with the host species richness of animal orders (Fig. 4). Since reservoir species richness did not affect the probability that viruses were zoonotic (Fig. 2A), direct effects of species richness—which might occur if viral maintenance by more species rich host orders facilitates zoonotic transmission by selecting for broader host range—are unlikely (2). Instead, our results support a numerical, host species-neutral explanation: more species-rich animal orders maintain more viruses and hence more zoonoses. Indeed, after controlling for diminished viral richness in birds compared to mammals, key groups including bats and rodents harbored close to the number of zoonoses expected from their species richness (Fig. 4). These results mirror—and potentially explain—observations that the risk of zoonotic emergence is elevated in regions with high species richness (3, 40), since more virus species and hence zoonoses would be expected in species-rich habitats. More generally, our results suggest that the processes which shape viral richness (i.e., extinction, codivergence, and host shifts) do not vary enough among animal orders to create significant differences in the average number of viruses per species across reservoir orders. One implication of the relationship between reservoir species richness and the number of zoonoses is that surveillance efforts aimed at finding potential zoonoses should scale with the species richness of reservoir groups. This recommendation differs from the current practice which is based on the a priori expectation that certain groups (e.g., bats, rodents, and primates) are more likely to maintain zoonotic viruses (7). Analogously, our results underscore the challenges of identifying unknown reservoirs for viruses of importance to human health, since sampling effort would need to scale with local biodiversity, which itself may be uncertain.

Our dataset and analytical approach differed in several epidemiologically important ways from previous studies which suggested variation in viral zoonotic propensity across animal groups (9, 12). First, restricting virus–reservoir associations to the order level allowed us to test hypotheses on the role of broad animal groups on zoonotic origins in the face of widespread uncertainty in the identity of viral reservoirs at the host species level (22, 23, 27). This meant excluding human viruses that occasionally infect nonhumans and all associations between viruses and nonhuman hosts which are not currently considered to be important in natural transmission cycles. While it is conceivable that some excluded host–virus associations have an unrecognized role in transmission, adding 302 previously reported associations which did not meet our criteria did not qualitatively change our results (SI Appendix, Fig. S6). Second, we considered a single reservoir order for most viruses rather than modeling every association of each virus with each infected host species within that order independently. This was critical to avoid potentially spurious effects driven by surveillance effort and multiple observations of the same virus in closely related species. For example, Dengue virus (DENV) has been detected in at least 20 bat species, which comprise 76% of DENV–host associations (9, 12), but nonhuman primates, not bats, are the currently accepted reservoirs of zoonotic DENV outbreaks (4143). Our dataset therefore included a single primate reservoir since the majority of DENV–host associations would have obscured conclusions on zoonotic origins. Finally, unlike previous studies, we included avian viruses; however, restricting our analysis to mammalian viruses failed to recover reservoir host effects on zoonotic risk (SI Appendix, Fig. S7). One possible explanation for the apparent discrepancy between our findings and those based on shared virus detections could be that heightened surveillance for or susceptibility to zoonoses has led to elevated detections of spillover infections in previously identified “special hosts.” Our results highlight the importance of separating exposure and infection from transmission in future studies which involve reservoirs of infection.

A clear limitation of our approach was that we were unable to consider traits that vary within reservoir groups (e.g., reproductive rates, population size, and geographic range size) which may moderate the baseline zoonotic risk by altering viral richness, transmission dynamics, or ecological contacts of hosts with humans (44). In addition, even at the broad level of host taxonomy we used, knowledge of virus–reservoir relationships and zoonotic capability is incomplete and unevenly distributed among host groups (45). Analogous analyses of the capability of viruses to infect nonhuman hosts could also enable broader understanding of the determinants of cross-species transmission but will require constructing comprehensive datasets of infection histories in these alternative species. Finally, we evaluated only viral richness and whether viruses were reported to infect humans. Whether viruses from different reservoirs differ systematically in their pathogenicity, capacity to transmit among humans, or in their frequency of zoonotic transmission cannot be assessed from our data.

In summary, our analysis suggests that variation in the frequency of zoonoses among major bird and mammal reservoir groups is an emergent property of variation in host and virus species richness. We find no evidence that intrinsic or ecological differences among animal groups increases the number of viruses they maintain or the likelihood that any given virus is zoonotic. Basing public health surveillance and research strategies aiming to identify high-risk viruses on the assumption that some taxonomic orders of hosts are disproportionate sources of zoonoses risks missing important zoonotic viruses while simultaneously reenforcing patterns that may reflect detection biases rather than zoonotic risk.

Materials and Methods

Database Construction.

We studied 35 virus families listed as infecting animals in either Fields Virology or the ViralZone web resource (Adenoviridae, Anelloviridae, Arenaviridae, Arteriviridae, Asfarviridae, Astroviridae, Birnaviridae, Bornaviridae, Caliciviridae, Circoviridae, Coronaviridae, Filoviridae, Flaviviridae, Genomoviridae, Hantaviridae, Hepadnaviridae, Hepeviridae, Herpesviridae, Nairoviridae, Orthomyxoviridae, Papillomaviridae, Paramyxoviridae, Parvoviridae, Peribunyaviridae, Phenuiviridae, Picobirnaviridae, Picornaviridae, Pneumoviridae, Polyomaviridae, Poxviridae, Reoviridae, Retroviridae, Rhabdoviridae, Tobaniviridae, and Togaviridae) (39, 46). For all data-collection steps below, virus names were matched to the latest accepted taxonomy according to version 2018b of the ICTV Master Species List by referring to historical taxonomic releases (47).

Following Babayan et al. (27), data on the reservoirs known to maintain the included virus species were obtained by searching common virology textbooks, such as Fields Virology (39), followed by in-depth literature searches until at least one reservoir or consistent evidence that the reservoir is currently considered as unknown was found. We summarized viral maintenance to the level of taxonomic orders of reservoirs because 1) the special reservoir hypothesis is generally articulated in terms of taxonomic order (e.g., applying to Chiroptera or Rodentia) and 2) order-level analyses constituted a reasonable compromise between taxonomic resolution and sample size, maximizing the number of virus species which could be included (27). We supplemented the single-stranded RNA virus dataset of Babayan et al. (27) with 344 additional records representing all recognized species in the families above for which reservoirs could be found. When there was evidence for independent maintenance by multiple reservoir orders, all known virus species–reservoir order combinations were recorded. For example, Rabies lyssavirus is maintained by both Carnivora and Chiroptera, but never as part of the same transmission cycle (48). Nineteen such virus species were detected, associated with 2.5 reservoir orders on average. Viruses known to be maintained by humans were retained if there was evidence for independent maintenance of a separate viral lineage in nonhuman hosts (n = 25) and otherwise discarded (n = 72). Yellow fever virus, for example, can be maintained by humans but also has an independent nonhuman primate reservoir community, and lineages from such maintenance cycles are zoonotic (39). Two virus species, Mammalian orthoreovirus and Usutu virus, had reservoir communities currently thought to span multiple taxonomic orders and were excluded from further analysis. Finally, the dataset was restricted to contain only viruses associated with mammalian and avian reservoir groups for which at least five viruses were known. The zoonotic status of individual virus species was obtained by combining records of detected human infections from Olival et al. (9) (n = 342 virus species) and Woolhouse and Brierley (29) (n = 70) with additional literature searching (n = 3). Only detections where the identity of the virus infecting humans was confirmed to species level by PCR or sequencing were considered.

Statistical Modeling.

We used logistic regression models to assess the association between reservoir group and zoonotic status (a binary response variable). Because at least one previously reported predictor of zoonotic status—publication count—was expected to be nonlinear (9), we used generalized additive mixed models (48). Three possible representations of a reservoir host effect were included (described below in more detail) and combined with all possible combinations of additional variables that were previously reported to predict zoonotic status. These included measures of research effort, the phylogenetic distance between each reservoir taxonomic order and primates, the species richness of each reservoir order, whether or not the virus was transmitted by arthropods or replicated exclusively in the cytoplasm, and a hierarchical representation of virus taxonomy. Previously reported variables relating to host species, such as geographic overlap with humans, could not be included when summarizing reservoirs at the level of taxonomic order.

The simplest reservoir effect was a random intercept for each reservoir taxonomic order, with all reservoir orders assumed independent. This represented the typically assumed special reservoir effect, in which some reservoirs are more prone to maintain zoonotic viruses than others. A second representation allowed clustering on the reservoir phylogeny to represent the hypothesis that related reservoir groups have correlated associations with zoonotic viruses. For example, mammalian reservoirs may be associated with a larger fraction of zoonoses than avian reservoirs, or related mammalian clades may share phylogenetically conserved features which shape their association with zoonoses. This phylogenetic random effect was implemented as a multivariate normal distribution, where phylogenetic relationships among taxa determined the amount of correlation between randomly sampled intercepts for different reservoir taxonomic orders (51). The variance–covariance matrix of this distribution took the form σ2Aσ2A, where σ2σ2 is a variance parameter to be estimated and A is a known variance–covariance matrix derived from a phylogeny (51, 52). We used a composite time-scaled reservoir phylogeny representing the mean divergence dates for all clades estimated across multiple studies, as contained in the TimeTree database (51). Following Longdon et al. (36), this phylogeny was converted to a variance–covariance matrix by assuming a Brownian motion model of trait evolution, using the vcv.phylo function in the APE package in R version 3.5.1 (52, 53). The third representation of a reservoir effect allowed independent random intercepts for each combination of reservoir order and virus family (i.e., the random effect of reservoir order was nested within virus family). This represented the hypothesis that specific reservoirs influence the propensity for viruses to be zoonotic for only some virus families, or that the identity of special reservoirs differs between families.

We used two measures to correct for the effects of variation in research effort on observations of zoonotic transmission: the numbers of results matching PubMed Central queries related to 1) virus species and 2) reservoir group (on 1 November 2019). For each virus species, this query was “<taxid>[Organism:noexp],” where “<taxid>” was replaced by the NCBI Taxonomy ID corresponding to each virus species. Viruses with no entry in the NCBI taxonomy database were removed from all analyses (this affected Cercopithecine gammaherpesvirus 14 and Hare fibroma virus, neither of which have publicly available sequence data in GenBank, meaning their reported reservoir associations are questionable). To capture a measure of the virus-related research effort in each reservoir group, a set of queries of the form “<taxid>[Organism:noexp] AND virus” were constructed, replacing “<taxid>” with the NCBI Taxonomy ID of each taxonomic order in turn. For nonhuman primates, this query was modified to “(txid9443[Organism:noexp] NOT txid9606[Organism:noexp]) AND virus,” where “txid9443” is the Taxonomy ID for the order Primates, and “txid9606” is the Taxonomy ID specific to Homo sapiens. Both variables were included as the natural logarithm of the respective publication counts, reflecting our prior belief that the effect of increasing numbers of publications would become saturated at high values. Nevertheless, we also allowed for additional nonlinear effects by fitting both variables as thin-plate smooths with 10 and 8 knots for virus and reservoir publication counts, respectively (54).

Phylogenetic distance was calculated as the cophenetic distance between each reservoir order and primates, using the same time-scaled reservoir phylogeny as above. Following Olival et al. (9), this effect was log(x + 1)-transformed in all models. The species richness represented by each reservoir order was derived from the Catalogue of Life using version 0.9.6 of the taxize library in R (55, 56). Both variables were fit as a thin-plate smooths with 6 and 10 knots, respectively.

The taxonomic random effect of virus family used the same specification as the reservoir phylogenetic effect above. Because the included virus families were too diverse to be represented in a single phylogeny (and might not share a common ancestor), a variance–covariance matrix representing currently accepted virus taxonomic relationships was generated. This matrix reflects the proportion of the taxonomy that is shared between virus families. Specifically, pairs of viruses were assigned a similarity score N/max(N), where N is the number of taxonomic levels they share, and max(N) the total number of taxonomic levels. This calculation was performed considering all taxonomic levels from realm to family. Thus, viruses in the same virus family received a similarity value of 1, while viruses from different families in the same order (e.g., Bunyavirales) received a value of 0.8. Virus species sharing no taxonomic levels were treated as independent (similarity = 0). Missing taxonomic assignments were interpolated to retain a comparable number of levels across all viruses, ensuring that all viruses remained independent at all levels not supported by the official ICTV taxonomy. For example, since many viruses are not classified using suborders a gap between order and family was bridged by creating a new level, assigning each family to its own unique suborder. This approach generated several free-floating branches, which are assumed independent in our models, but this is consistent with current virus taxonomy (ICTV Master Species List 2018b, https://ictv.global/files/master-species-lists/; SI Appendix, Fig. S3).

All models were fit using restricted maximum likelihood in the mgcv library in R and subsequently ranked by AIC (57, 58). The validity of models was checked using both standard methods implemented in the mgcv library and by inspecting simulated residuals generated using the DHARMa library in R (59). To calculate the proportion of the deviance explained by each term, each model was compared to submodels fit in the absence of individual terms, fixing the values for the smoothing parameters of the remaining terms to those estimated in the full model. The proportion of the deviance explained was calculated as (DiDF)/D0(Di−DF)/D0, where DiDi is the deviance of model i, DFDF is the deviance of the full model, and D0D0 is the deviance of an intercept-only model.

To investigate potential explanations for differences in either the number of virus species or the number of zoonotic species associated with each reservoir order, two independent sets of negative binomial generalized linear models (GLMs) were fit to the counts of each virus type using the MASS library in R (60). Both sets of models contained all possible combinations of variables describing the log number virus-related publications associated with each reservoir, log phylogenetic distance to primates, log species richness in each reservoir, and a binary variable describing whether the reservoir is mammalian. We considered simpler Poisson GLMs instead of the negative binomial GLMs, but these showed strong overdispersion in simulated residuals using the DHARMa library.

Diversity Calculations.

The distribution of viral diversity among reservoir groups was quantified by calculating profiles of normalized alpha diversity using the rdiversity library in R (30). These calculations incorporated a species-level taxonomic similarity matrix, reflecting the proportion of the taxonomy that is shared between virus species and calculated as described for the family-level similarity matrix above.

Data Availability.

Data and code used in this manuscript are available at https://doi.org/10.5281/zenodo.3516613.

Acknowledgments

We thank Dan Haydon and Roman Biek for helpful comments on earlier versions of this manuscript, as well as two anonymous reviewers, whose suggestions greatly improved the clarity of this publication. D.G.S. was supported by a Sir Henry Dale Fellowship, jointly funded by the Wellcome Trust and Royal Society (102507/Z/13/Z) and a Wellcome Senior Research Fellowship (217221/Z/19/Z). Additional funding was provided by the Medical Research Council through programme grants MC_UU_12014/8 and MC_UU_12014/12. Reservoir silhouettes were obtained from phylopic.org and were created by Matt Martyniuk (Anseriformes), Brian Gratwicke and T. Michael Keesey (Carnivora), and Sarah Werning (Lagomorpha), used with permission (https://creativecommons.org/licenses/by/3.0). Additional silhouettes by Andrew Butko (Passeriformes; https://creativecommons.org/licenses/by-sa/3.0) and Tamara L. Clark (Perissodactyla; https://creativecommons.org/licenses/by-nc-sa/3.0). All other silhouettes are in the public domain.

Footnotes

  • Copyright © 2020 the Author(s). Published by PNAS.

This open access article is distributed under Creative Commons Attribution License 4.0 (CC BY).

Viral zoonotic risk is homogenous among taxonomic orders of mammalian and avian reservoir hosts | PNAS

References

    1. L. H. Taylor,
    2. S. M. Latham,
    3. M. E. Woolhouse
    , Risk factors for human disease emergence. Philos. Trans. R. Soc. Lond. B Biol. Sci. 356, 983–989 (2001).OpenUrlCrossRefPubMedGoogle Scholar
    1. M. E. J. Woolhouse,
    2. S. Gowtage-Sequeria
    , Host range and emerging and reemerging pathogens. Emerg. Infect. Dis. 11, 1842–1847 (2005).OpenUrlCrossRefPubMedGoogle Scholar
    1. K. E. Jones et al
    ., Global trends in emerging infectious diseases. Nature 451, 990–993 (2008).OpenUrlCrossRefPubMedGoogle Scholar
    1. D. A. King,
    2. C. Peckham,
    3. J. K. Waage,
    4. J. Brownlie,
    5. M. E. J. Woolhouse
    , Infectious diseases: Preparing for the future. Science 313, 1392–1393 (2006).OpenUrlAbstract/FREE Full TextGoogle Scholar
    1. S. S. Morse et al
    ., Prediction and prevention of the next pandemic zoonosis. Lancet 380, 1956–1965 (2012).OpenUrlCrossRefPubMedGoogle Scholar
    1. D. Carroll et al
    ., The global virome project. Science 359, 872–874 (2018).OpenUrlAbstract/FREE Full TextGoogle Scholar
    1. D. Carroll et al
    ., Building a global atlas of zoonotic viruses. Bull. World Health Organ. 96, 292–294 (2018).OpenUrlCrossRefGoogle Scholar
    1. M. Woolhouse,
    2. E. Gaunt
    , Ecological origins of novel human pathogens. Crit. Rev. Microbiol. 33, 231–242 (2007).OpenUrlCrossRefPubMedGoogle Scholar
    1. K. J. Olival et al
    ., Host and viral traits predict zoonotic spillover from mammals. Nature 546, 646–650 (2017).OpenUrlCrossRefPubMedGoogle Scholar
    1. N. Cooper et al
    ., Phylogenetic host specificity and understanding parasite sharing in primates. Ecol. Lett. 15, 1370–1377 (2012).OpenUrlCrossRefPubMedGoogle Scholar
    1. S. Cleaveland,
    2. M. K. Laurenson,
    3. L. H. Taylor
    , Diseases of humans and their domestic mammals: Pathogen characteristics, host range and the risk of emergence. Philos. Trans. R. Soc. Lond. B Biol. Sci. 356, 991–999 (2001).OpenUrlCrossRefPubMedGoogle Scholar
    1. A. D. Luis et al
    ., A comparison of bats and rodents as reservoirs of zoonotic viruses: Are bats special? Proc. Biol. Sci. 280, 20122753 (2013).OpenUrlCrossRefPubMedGoogle Scholar
    1. B. A. Han,
    2. A. M. Kramer,
    3. J. M. Drake
    , Global patterns of zoonotic disease in mammals. Trends Parasitol. 32, 565–577 (2016).OpenUrlGoogle Scholar
    1. N. D. Wolfe,
    2. C. P. Dunavan,
    3. J. Diamond
    , Origins of major human infectious diseases. Nature 447, 279–283 (2007).OpenUrlCrossRefPubMedGoogle Scholar
    1. G. Zhang et al
    ., Comparative analysis of bat genomes provides insight into the evolution of flight and immunity. Science 339, 456–460 (2013).OpenUrlAbstract/FREE Full TextGoogle Scholar
    1. T. J. O’Shea et al
    ., Bat flight and zoonotic viruses. Emerg. Infect. Dis. 20, 741–745 (2014).OpenUrlCrossRefPubMedGoogle Scholar
    1. C. E. Brook,
    2. A. P. Dobson
    , Bats as ‘special’ reservoirs for emerging zoonotic pathogens. Trends Microbiol. 23, 172–180 (2015).OpenUrlCrossRefPubMedGoogle Scholar
    1. P. Zhou et al
    ., Contraction of the type I IFN locus and unusual constitutive expression of IFN-α in bats. Proc. Natl. Acad. Sci. U.S.A. 113, 2696–2701 (2016).OpenUrlAbstract/FREE Full TextGoogle Scholar
    1. M. Ahn et al
    ., Dampened NLRP3-mediated inflammation in bats and implications for a special viral reservoir host. Nat. Microbiol. 4, 789–799 (2019).OpenUrlGoogle Scholar
    1. C. E. Brook et al
    ., Accelerated viral dynamics in bat cell lines, with implications for zoonotic emergence. eLife 9, e48401 (2020).OpenUrlGoogle Scholar
    1. K. J. Olival,
    2. J. H. Epstein,
    3. L.-F. Wang,
    4. H. E. Field,
    5. P. Daszak
    , “Are bats exceptional viral reservoirs?” in New Directions in Conservation Medicine: Applied Cases of Ecological Health, A. A. Aguirre, R. Ostfeld, P. Daszak, Eds. (Oxford University Press, 2012), pp. 195–212.Google Scholar
    1. D. T. Haydon,
    2. S. Cleaveland,
    3. L. H. Taylor,
    4. M. K. Laurenson
    , Identifying reservoirs of infection: A conceptual and practical challenge. Emerg. Infect. Dis. 8, 1468–1473 (2002).OpenUrlCrossRefPubMedGoogle Scholar
    1. M. Viana et al
    ., Assembling evidence for identifying reservoirs of infection. Trends Ecol. Evol. 29, 270–279 (2014).OpenUrlCrossRefPubMedGoogle Scholar
    1. P. Simmonds et al
    ., Consensus statement: Virus taxonomy in the age of metagenomics. Nat. Rev. Microbiol. 15, 161–168 (2017).OpenUrlCrossRefPubMedGoogle Scholar
    1. D. G. Streicker et al
    ., Host phylogeny constrains cross-species emergence and establishment of rabies virus in bats. Science 329, 676–679 (2010).OpenUrlAbstract/FREE Full TextGoogle Scholar
    1. A. Kitchen,
    2. L. A. Shackelton,
    3. E. C. Holmes
    , Family level phylogenies reveal modes of macroevolution in RNA viruses. Proc. Natl. Acad. Sci. U.S.A. 108, 238–243 (2011).OpenUrlAbstract/FREE Full TextGoogle Scholar
    1. S. A. Babayan,
    2. R. J. Orton,
    3. D. G. Streicker
    , Predicting reservoir hosts and arthropod vectors from evolutionary signatures in RNA virus genomes. Science 362, 577–580 (2018).OpenUrlAbstract/FREE Full TextGoogle Scholar
    1. A. D. Washburne et al
    ., Taxonomic patterns in the zoonotic potential of mammalian viruses. PeerJ 6, e5979 (2018).OpenUrlCrossRefGoogle Scholar
    1. M. E. J. Woolhouse,
    2. L. Brierley
    , Epidemiological characteristics of human-infective RNA viruses. Sci. Data 5, 180017 (2018).OpenUrlGoogle Scholar
    1. R. Reeve et al
    ., How to partition diversity. arXiv:14046520v3 (8 December 2016).Google Scholar
    1. S. Dorai-Raj
    , binom: Binomial confidence intervals for several parameterizations (R package, Version 1.1-1, 2014).Google Scholar
    1. C. H. Calisher,
    2. J. E. Childs,
    3. H. E. Field,
    4. K. V. Holmes,
    5. T. Schountz
    , Bats: Important reservoir hosts of emerging viruses. Clin. Microbiol. Rev. 19, 531–545 (2006).OpenUrlAbstract/FREE Full TextGoogle Scholar
    1. A. D. Luis et al
    ., Network analysis of host-virus communities in bats and rodents reveals determinants of cross-species transmission. Ecol. Lett. 18, 1153–1162 (2015).OpenUrlCrossRefGoogle Scholar
    1. U. Karakus et al
    ., MHC class II proteins mediate cross-species entry of bat influenza viruses. Nature 567, 109–112 (2019).OpenUrlCrossRefGoogle Scholar
    1. C. Rupprecht,
    2. I. Kuzmin,
    3. F. Meslin
    , Lyssaviruses and rabies: Current conundrums, concerns, contradictions and controversies. F1000 Res. 6, 184 (2017).OpenUrlGoogle Scholar
    1. B. Longdon,
    2. J. D. Hadfield,
    3. C. L. Webster,
    4. D. J. Obbard,
    5. F. M. Jiggins
    , Host phylogeny determines viral persistence and replication in novel hosts. PLoS Pathog. 7, e1002260 (2011).OpenUrlCrossRefPubMedGoogle Scholar
    1. S. Huang,
    2. O. R. Bininda-Emonds,
    3. P. R. Stephens,
    4. J. L. Gittleman,
    5. S. Altizer
    , Phylogenetically related and ecologically similar carnivores harbour similar parasite assemblages. J. Anim. Ecol. 83, 671–680 (2014).OpenUrlGoogle Scholar
    1. J. R. C. Pulliam,
    2. J. Dushoff
    , Ability to replicate in the cytoplasm predicts zoonotic transmission of livestock viruses. J. Infect. Dis. 199, 565–568 (2009).OpenUrlCrossRefPubMedGoogle Scholar
    1. D. M. Knipe,
    2. P. Howley
    , Eds., Fields Virology (Lippincott Williams & Wilkins, ed. 6, 2013).Google Scholar
    1. T. Allen et al
    ., Global hotspots and correlates of emerging zoonotic diseases. Nat. Commun. 8, 1124 (2017).OpenUrlCrossRefPubMedGoogle Scholar
    1. L. Perea-Martínez et al
    ., Experimental infection of Artibeus intermedius bats with serotype-2 dengue virus. Comp. Immunol. Microbiol. Infect. Dis. 36, 193–198 (2013).OpenUrlCrossRefPubMedGoogle Scholar
    1. S. Cabrera-Romo et al
    ., Experimental inoculation of Artibeus jamaicensis bats with dengue virus serotypes 1 or 4 showed no evidence of sustained replication. Am. J. Trop. Med. Hyg. 91, 1227–1234 (2014).OpenUrlAbstract/FREE Full TextGoogle Scholar
    1. A. Vicente-Santos et al
    ., Neotropical bats that co-habit with humans function as dead-end hosts for dengue virus. PLoS Negl. Trop. Dis. 11, e0005537 (2017).OpenUrlGoogle Scholar
    1. B. A. Han,
    2. J. P. Schmidt,
    3. S. E. Bowden,
    4. J. M. Drake
    , Rodent reservoirs of future zoonotic diseases. Proc. Natl. Acad. Sci. U.S.A. 112, 7039–7044 (2015).OpenUrlAbstract/FREE Full TextGoogle Scholar
    1. Y.-Z. Zhang,
    2. M. Shi,
    3. E. C. Holmes
    , Using metagenomics to characterize an expanding virosphere. Cell 172, 1168–1172 (2018).OpenUrlCrossRefGoogle Scholar
    1. C. Hulo,
    2. P. Masson,
    3. E. de Castro,
    4. P. Le Mercier
    , ViralZone. https://viralzone.expasy.org/. Accessed 21 October 2019.Google Scholar
    1. E. J. Lefkowitz et al
    ., Virus taxonomy: The database of the international committee on taxonomy of viruses (ICTV). Nucleic Acids Res. 46, D708–D717 (2018).OpenUrlCrossRefGoogle Scholar
    1. N. Mollentze,
    2. R. Biek,
    3. D. G. Streicker
    , The role of viral evolution in rabies host shifts and emergence. Curr. Opin. Virol. 8, 68–72 (2014).OpenUrlCrossRefGoogle Scholar
    1. N. Mollentze,
    2. D. G. Streicker
    , Viral zoonotic risk is homogenous among taxonomic orders of mammalian and avian reservoir hosts (Version 1.0.0). Zenodo. http://doi.org/10.5281/zenodo.3516613. Deposited 23 October 2019.Google Scholar
    1. S. N. Wood
    , Fast stable restricted maximum likelihood and marginal likelihood estimation of semiparametric generalized linear models. J. R. Stat. Soc. B 73, 3–36 (2011).OpenUrlCrossRefPubMedGoogle Scholar
    1. J. D. Hadfield,
    2. S. Nakagawa
    , General quantitative genetic methods for comparative biology: Phylogenies, taxonomies and multi-trait models for continuous and categorical characters. J. Evol. Biol. 23, 494–508 (2010).OpenUrlCrossRefPubMedGoogle Scholar
    1. S. N. Wood
    , Fast stable direct fitting and smoothness selection for generalized additive models. J. R. Stat. Soc. Series B Stat. Methodol. 70, 495–518 (2008).OpenUrlGoogle Scholar
    1. S. Kumar,
    2. G. Stecher,
    3. M. Suleski,
    4. S. B. Hedges
    , TimeTree: A resource for timelines, timetrees, and divergence times. Mol. Biol. Evol. 34, 1812–1819 (2017).OpenUrlCrossRefGoogle Scholar
    1. E. Paradis,
    2. J. Claude,
    3. K. Strimmer
    , APE: Analyses of phylogenetics and evolution in R language. Bioinformatics 20, 289–290 (2004).OpenUrlCrossRefPubMedGoogle Scholar
    1. R Core Team
    , R: A Language and Environment for Statistical Computing (R Foundation for Statistical Computing, 2018).Google Scholar
    1. S. N. Wood
    , Thin-plate regression splines. J. R. Stat. Soc. B 65, 95–114 (2003).OpenUrlCrossRefGoogle Scholar
    1. S. A. Chamberlain,
    2. E. Szöcs
    , Taxize: Taxonomic search and retrieval in R. F1000 Res. 2, 191 (2013).OpenUrlGoogle Scholar
    1. Y. Roskov et al
    ., Eds., Species 2000 & ITIS Catalogue of Life, 2015 Annual Checklist (Naturalis, 2015).Google Scholar
    1. H. Akaike
    , A new look at the statistical model identification. IEEE Trans. Automat. Contr. 19, 716–723 (1974).OpenUrlCrossRefGoogle Scholar
    1. S. N. Wood,
    2. N. Pya,
    3. B. Säfken
    , Smoothing parameter and model selection for general smooth models. J. Am. Stat. Assoc. 111, 1548–1563 (2016).OpenUrlCrossRefGoogle Scholar
    1. F. Hartig
    , DHARMa: Residual diagnostics for hierarchical (multi-level / mixed) regression models (R package, Version 0.2.4, 2019).Google Scholar
    1. W. N. Venables,
    2. B. D. Ripley
    , Modern Applied Statistics with S (Springer, ed. 4, 2002).Google Scholar

View Abstract

We recommend